

118
M. D. Petrovi´ c et al.
Table 2 The factors analysis results
No. Names of the factors Previous research
Eigenvalue Variance explained α
F1 Personal and
community benefits
of tourism
Lankford and Howard
(1994), Lankford et al.
(1994), Schneider et al.
(1997), Petrovi´ c et al.
(2016, 2017a, b)
5.930
16.976
0.873
F2 Negative impacts of
tourism
Rollins (1997),
Schneider et al. (1997),
Harrill and Potts
(2003), Petrovi´ c et al.
(2016, 2017a, b)
2.634
11.113
0.679
F3 Concern or support
for local tourism
development
Lankford and Howard
(1994), Petrovi´ c et al.
(2016, 2017a, b)
2.155
9.747
0.711
F4 General opinion on
tourism
Rollins (1997),
Petrovi´ c et al. (2016,
2017a, b)
1.678
8.991
0.707
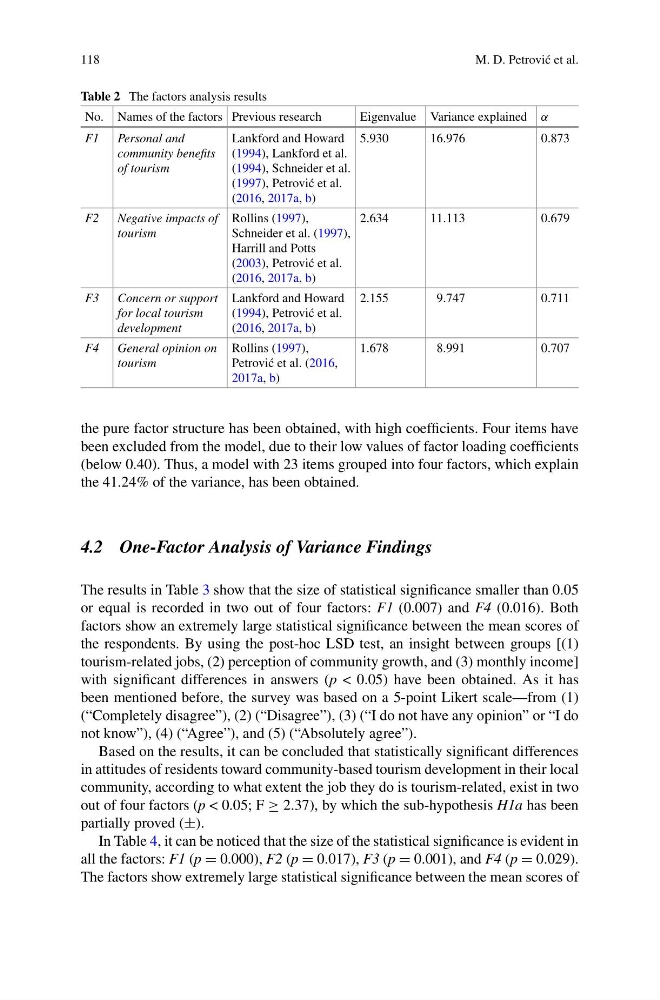
the pure factor structure has been obtained, with high coefficients. Four items have
been excluded from the model, due to their low values of factor loading coefficients
(below 0.40). Thus, a model with 23 items grouped into four factors, which explain
the 41.24% of the variance, has been obtained.
4.2 One-Factor Analysis of Variance Findings
The results in Table 3 show that the size of statistical significance smaller than 0.05
or equal is recorded in two out of four factors: F1 (0.007) and F4 (0.016). Both
factors show an extremely large statistical significance between the mean scores of
the respondents. By using the post-hoc LSD test, an insight between groups [(1)
tourism-related jobs, (2) perception of community growth, and (3) monthly income]
with significant differences in answers (p < 0.05) have been obtained. As it has
been mentioned before, the survey was based on a 5-point Likert scale—from (1)
(“Completely disagree”), (2) (“Disagree”), (3) (“I do not have any opinion” or “I do
not know”), (4) (“Agree”), and (5) (“Absolutely agree”).
Based on the results, it can be concluded that statistically significant differences
in attitudes of residents toward community-based tourism development in their local
community, according to what extent the job they do is tourism-related, exist in two
out of four factors (p < 0.05; F ≥ 2.37), by which the sub-hypothesis H1a has been
partially proved (±).
In Table 4, it can be noticed that the size of the statistical significance is evident in
all the factors: F1 (p = 0.000), F2 (p = 0.017), F3 (p = 0.001), and F4 (p = 0.029).
The factors show extremely large statistical significance between the mean scores of
M. D. Petrovi´ c et al.
Table 2 The factors analysis results
No. Names of the factors Previous research
Eigenvalue Variance explained α
F1 Personal and
community benefits
of tourism
Lankford and Howard
(1994), Lankford et al.
(1994), Schneider et al.
(1997), Petrovi´ c et al.
(2016, 2017a, b)
5.930
16.976
0.873
F2 Negative impacts of
tourism
Rollins (1997),
Schneider et al. (1997),
Harrill and Potts
(2003), Petrovi´ c et al.
(2016, 2017a, b)
2.634
11.113
0.679
F3 Concern or support
for local tourism
development
Lankford and Howard
(1994), Petrovi´ c et al.
(2016, 2017a, b)
2.155
9.747
0.711
F4 General opinion on
tourism
Rollins (1997),
Petrovi´ c et al. (2016,
2017a, b)
1.678
8.991
0.707
the pure factor structure has been obtained, with high coefficients. Four items have
been excluded from the model, due to their low values of factor loading coefficients
(below 0.40). Thus, a model with 23 items grouped into four factors, which explain
the 41.24% of the variance, has been obtained.
4.2 One-Factor Analysis of Variance Findings
The results in Table 3 show that the size of statistical significance smaller than 0.05
or equal is recorded in two out of four factors: F1 (0.007) and F4 (0.016). Both
factors show an extremely large statistical significance between the mean scores of
the respondents. By using the post-hoc LSD test, an insight between groups [(1)
tourism-related jobs, (2) perception of community growth, and (3) monthly income]
with significant differences in answers (p < 0.05) have been obtained. As it has
been mentioned before, the survey was based on a 5-point Likert scale—from (1)
(“Completely disagree”), (2) (“Disagree”), (3) (“I do not have any opinion” or “I do
not know”), (4) (“Agree”), and (5) (“Absolutely agree”).
Based on the results, it can be concluded that statistically significant differences
in attitudes of residents toward community-based tourism development in their local
community, according to what extent the job they do is tourism-related, exist in two
out of four factors (p < 0.05; F ≥ 2.37), by which the sub-hypothesis H1a has been
partially proved (±).
In Table 4, it can be noticed that the size of the statistical significance is evident in
all the factors: F1 (p = 0.000), F2 (p = 0.017), F3 (p = 0.001), and F4 (p = 0.029).
The factors show extremely large statistical significance between the mean scores of