

116
M. D. Petrovi´ c et al.
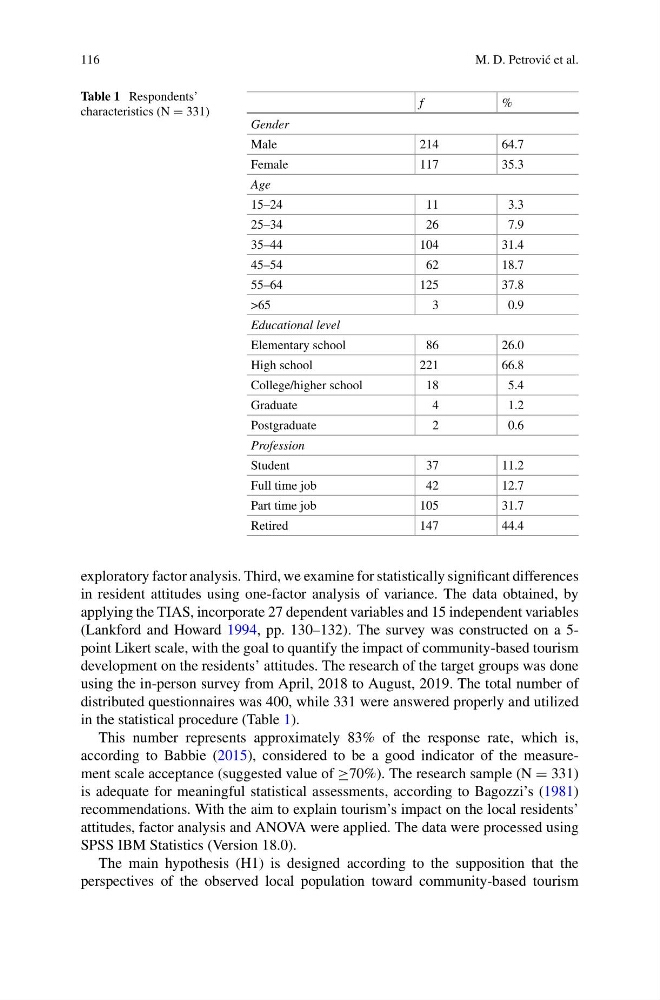
Table 1 Respondents’
characteristics (N = 331)
f
%
Gender
Male
214
64.7
Female
117
35.3
Age
15–24
11
3.3
25–34
26
7.9
35–44
104
31.4
45–54
62
18.7
55–64
125
37.8
>65
3
0.9
Educational level
Elementary school
86
26.0
High school
221
66.8
College/higher school
18
5.4
Graduate
4
1.2
Postgraduate
2
0.6
Profession
Student
37
11.2
Full time job
42
12.7
Part time job
105
31.7
Retired
147
44.4
exploratory factor analysis. Third, we examine for statistically significant differences
in resident attitudes using one-factor analysis of variance. The data obtained, by
applying the TIAS, incorporate 27 dependent variables and 15 independent variables
(Lankford and Howard 1994, pp. 130–132). The survey was constructed on a 5point Likert scale, with the goal to quantify the impact of community-based tourism
development on the residents’ attitudes. The research of the target groups was done
using the in-person survey from April, 2018 to August, 2019. The total number of
distributed questionnaires was 400, while 331 were answered properly and utilized
in the statistical procedure (Table 1).
This number represents approximately 83% of the response rate, which is,
according to Babbie (2015), considered to be a good indicator of the measurement scale acceptance (suggested value of ≥70%). The research sample (N = 331)
is adequate for meaningful statistical assessments, according to Bagozzi’s (1981)
recommendations. With the aim to explain tourism’s impact on the local residents’
attitudes, factor analysis and ANOVA were applied. The data were processed using
SPSS IBM Statistics (Version 18.0).
The main hypothesis (H1) is designed according to the supposition that the
perspectives of the observed local population toward community-based tourism
M. D. Petrovi´ c et al.
Table 1 Respondents’
characteristics (N = 331)
f
%
Gender
Male
214
64.7
Female
117
35.3
Age
15–24
11
3.3
25–34
26
7.9
35–44
104
31.4
45–54
62
18.7
55–64
125
37.8
>65
3
0.9
Educational level
Elementary school
86
26.0
High school
221
66.8
College/higher school
18
5.4
Graduate
4
1.2
Postgraduate
2
0.6
Profession
Student
37
11.2
Full time job
42
12.7
Part time job
105
31.7
Retired
147
44.4
exploratory factor analysis. Third, we examine for statistically significant differences
in resident attitudes using one-factor analysis of variance. The data obtained, by
applying the TIAS, incorporate 27 dependent variables and 15 independent variables
(Lankford and Howard 1994, pp. 130–132). The survey was constructed on a 5point Likert scale, with the goal to quantify the impact of community-based tourism
development on the residents’ attitudes. The research of the target groups was done
using the in-person survey from April, 2018 to August, 2019. The total number of
distributed questionnaires was 400, while 331 were answered properly and utilized
in the statistical procedure (Table 1).
This number represents approximately 83% of the response rate, which is,
according to Babbie (2015), considered to be a good indicator of the measurement scale acceptance (suggested value of ≥70%). The research sample (N = 331)
is adequate for meaningful statistical assessments, according to Bagozzi’s (1981)
recommendations. With the aim to explain tourism’s impact on the local residents’
attitudes, factor analysis and ANOVA were applied. The data were processed using
SPSS IBM Statistics (Version 18.0).
The main hypothesis (H1) is designed according to the supposition that the
perspectives of the observed local population toward community-based tourism