

86
D. Puciato and M. Rozpara
in the equality of men and women, should lead to the disappearance of these differences. An interesting social group, in which tendencies to erase gender differences
should be particularly pronounced, seems to be male and female university students.
Considering the above introductory remarks, the aim of this study is to assess the
gender differences in physical activity of male and female university students from
Wrocław.
2 Material and Methods
The study was conducted in 2014 and 2015 in Wrocław, Poland. The study sample
comprised 637 participants (441 women, 196 men) aged between 18 and 34 years,
who were full-time and part-time students of Wrocław universities. The research
project was granted a positive opinion by the Commission of Bioethics of the
University School of Physical Education in Wroclaw.
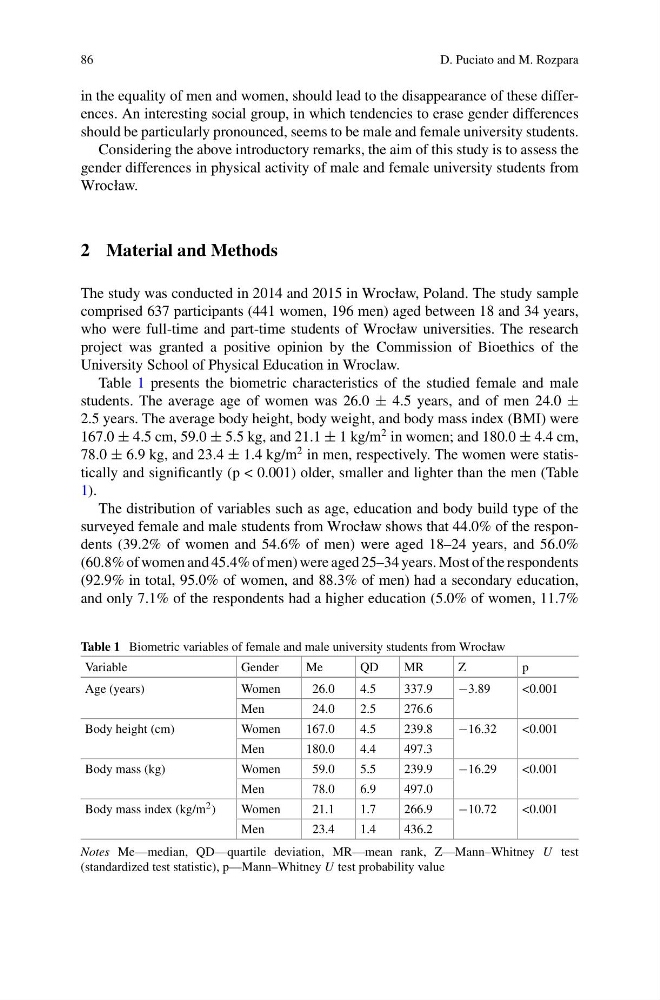
Table 1 presents the biometric characteristics of the studied female and male
students. The average age of women was 26.0 ± 4.5 years, and of men 24.0 ±
2.5 years. The average body height, body weight, and body mass index (BMI) were
167.0 ± 4.5 cm, 59.0 ± 5.5 kg, and 21.1 ± 1 kg/m
2 in women; and 180.0 ± 4.4 cm,
78.0 ± 6.9 kg, and 23.4 ± 1.4 kg/m
2 in men, respectively. The women were statistically and significantly (p < 0.001) older, smaller and lighter than the men (Table
1).
The distribution of variables such as age, education and body build type of the
surveyed female and male students from Wrocław shows that 44.0% of the respondents (39.2% of women and 54.6% of men) were aged 18–24 years, and 56.0%
(60.8% of women and 45.4% of men) were aged 25–34 years. Most of the respondents
(92.9% in total, 95.0% of women, and 88.3% of men) had a secondary education,
and only 7.1% of the respondents had a higher education (5.0% of women, 11.7%
Table 1 Biometric variables of female and male university students from Wrocław
Variable
Gender
Me
QD
MR
Z
p
Age (years)
Women
26.0
4.5
337.9
−3.89
<0.001
Men
24.0
2.5
276.6
Body height (cm)
Women
167.0
4.5
239.8
−16.32
<0.001
Men
180.0
4.4
497.3
Body mass (kg)
Women
59.0
5.5
239.9
−16.29
<0.001
Men
78.0
6.9
497.0
Body mass index (kg/m 2 )
Women
21.1
1.7
266.9
−10.72
<0.001
Men
23.4
1.4
436.2
Notes Me—median, QD—quartile deviation, MR—mean rank, Z—Mann–Whitney U test
(standardized test statistic), p—Mann–Whitney U test probability value
D. Puciato and M. Rozpara
in the equality of men and women, should lead to the disappearance of these differences. An interesting social group, in which tendencies to erase gender differences
should be particularly pronounced, seems to be male and female university students.
Considering the above introductory remarks, the aim of this study is to assess the
gender differences in physical activity of male and female university students from
Wrocław.
2 Material and Methods
The study was conducted in 2014 and 2015 in Wrocław, Poland. The study sample
comprised 637 participants (441 women, 196 men) aged between 18 and 34 years,
who were full-time and part-time students of Wrocław universities. The research
project was granted a positive opinion by the Commission of Bioethics of the
University School of Physical Education in Wroclaw.
Table 1 presents the biometric characteristics of the studied female and male
students. The average age of women was 26.0 ± 4.5 years, and of men 24.0 ±
2.5 years. The average body height, body weight, and body mass index (BMI) were
167.0 ± 4.5 cm, 59.0 ± 5.5 kg, and 21.1 ± 1 kg/m
2 in women; and 180.0 ± 4.4 cm,
78.0 ± 6.9 kg, and 23.4 ± 1.4 kg/m
2 in men, respectively. The women were statistically and significantly (p < 0.001) older, smaller and lighter than the men (Table
1).
The distribution of variables such as age, education and body build type of the
surveyed female and male students from Wrocław shows that 44.0% of the respondents (39.2% of women and 54.6% of men) were aged 18–24 years, and 56.0%
(60.8% of women and 45.4% of men) were aged 25–34 years. Most of the respondents
(92.9% in total, 95.0% of women, and 88.3% of men) had a secondary education,
and only 7.1% of the respondents had a higher education (5.0% of women, 11.7%
Table 1 Biometric variables of female and male university students from Wrocław
Variable
Gender
Me
QD
MR
Z
p
Age (years)
Women
26.0
4.5
337.9
−3.89
<0.001
Men
24.0
2.5
276.6
Body height (cm)
Women
167.0
4.5
239.8
−16.32
<0.001
Men
180.0
4.4
497.3
Body mass (kg)
Women
59.0
5.5
239.9
−16.29
<0.001
Men
78.0
6.9
497.0
Body mass index (kg/m 2 )
Women
21.1
1.7
266.9
−10.72
<0.001
Men
23.4
1.4
436.2
Notes Me—median, QD—quartile deviation, MR—mean rank, Z—Mann–Whitney U test
(standardized test statistic), p—Mann–Whitney U test probability value