

74
7 Transboundary River Basins in the European Union and the …
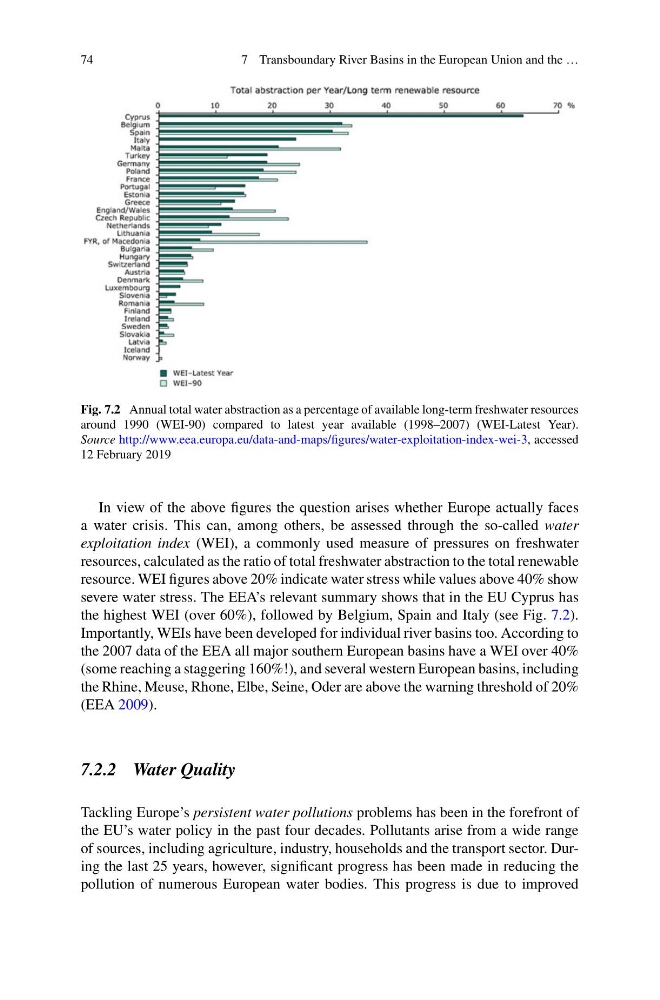
Fig. 7.2 Annual total water abstraction as a percentage of available long-term freshwater resources
around 1990 (WEI-90) compared to latest year available (1998–2007) (WEI-Latest Year).
Source http://www.eea.europa.eu/data-and-maps/figures/water-exploitation-index-wei-3, accessed
12 February 2019
In view of the above figures the question arises whether Europe actually faces
a water crisis. This can, among others, be assessed through the so-called water
exploitation index (WEI), a commonly used measure of pressures on freshwater
resources, calculated as the ratio of total freshwater abstraction to the total renewable
resource. WEI figures above 20% indicate water stress while values above 40% show
severe water stress. The EEA’s relevant summary shows that in the EU Cyprus has
the highest WEI (over 60%), followed by Belgium, Spain and Italy (see Fig. 7.2).
Importantly, WEIs have been developed for individual river basins too. According to
the 2007 data of the EEA all major southern European basins have a WEI over 40%
(some reaching a staggering 160%!), and several western European basins, including
the Rhine, Meuse, Rhone, Elbe, Seine, Oder are above the warning threshold of 20%
(EEA 2009).
7.2.2 Water Quality
Tackling Europe’s persistent water pollutions problems has been in the forefront of
the EU’s water policy in the past four decades. Pollutants arise from a wide range
of sources, including agriculture, industry, households and the transport sector. During the last 25 years, however, significant progress has been made in reducing the
pollution of numerous European water bodies. This progress is due to improved
7 Transboundary River Basins in the European Union and the …
Fig. 7.2 Annual total water abstraction as a percentage of available long-term freshwater resources
around 1990 (WEI-90) compared to latest year available (1998–2007) (WEI-Latest Year).
Source http://www.eea.europa.eu/data-and-maps/figures/water-exploitation-index-wei-3, accessed
12 February 2019
In view of the above figures the question arises whether Europe actually faces
a water crisis. This can, among others, be assessed through the so-called water
exploitation index (WEI), a commonly used measure of pressures on freshwater
resources, calculated as the ratio of total freshwater abstraction to the total renewable
resource. WEI figures above 20% indicate water stress while values above 40% show
severe water stress. The EEA’s relevant summary shows that in the EU Cyprus has
the highest WEI (over 60%), followed by Belgium, Spain and Italy (see Fig. 7.2).
Importantly, WEIs have been developed for individual river basins too. According to
the 2007 data of the EEA all major southern European basins have a WEI over 40%
(some reaching a staggering 160%!), and several western European basins, including
the Rhine, Meuse, Rhone, Elbe, Seine, Oder are above the warning threshold of 20%
(EEA 2009).
7.2.2 Water Quality
Tackling Europe’s persistent water pollutions problems has been in the forefront of
the EU’s water policy in the past four decades. Pollutants arise from a wide range
of sources, including agriculture, industry, households and the transport sector. During the last 25 years, however, significant progress has been made in reducing the
pollution of numerous European water bodies. This progress is due to improved