

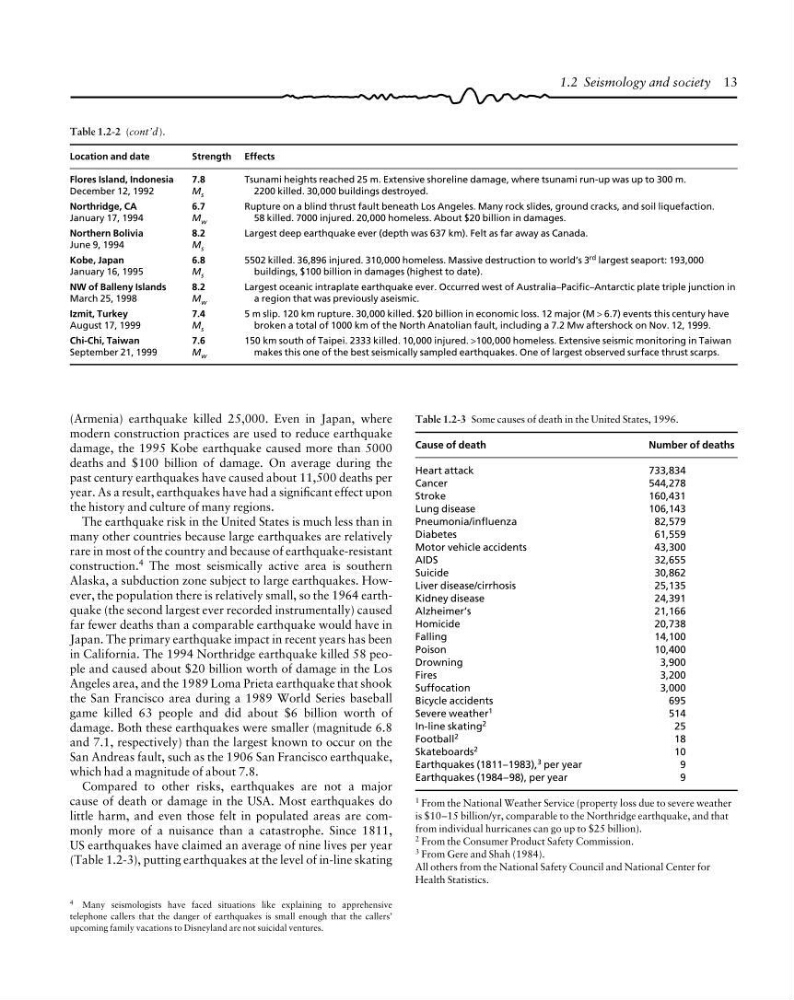
Table 1.2-2 (cont’d ).
Location and date
Strength Effects
Flores Island, Indonesia
7.8
December 12, 1992
M s
Northridge, CA
6.7
January 17, 1994
M w
Northern Bolivia
8.2
June 9, 1994
M s
Kobe, Japan
6.8
January 16, 1995
M s
NW of Balleny Islands
8.2
March 25, 1998
M w
Izmit, Turkey
7.4
August 17, 1999
M s
Chi-Chi, Taiwan
7.6
September 21, 1999
M w
Tsunami heights reached 25 m. Extensive shoreline damage, where tsunami run-up was up to 300 m.
2200 killed. 30,000 buildings destroyed.
Rupture on a blind thrust fault beneath Los Angeles. Many rock slides, ground cracks, and soil liquefaction.
58 killed. 7000 injured. 20,000 homeless. About $20 billion in damages.
Largest deep earthquake ever (depth was 637 km). Felt as far away as Canada.
5502 killed. 36,896 injured. 310,000 homeless. Massive destruction to world’s 3
rd largest seaport: 193,000
buildings, $100 billion in damages (highest to date).
Largest oceanic intraplate earthquake ever. Occurred west of Australia–Pacific–Antarctic plate triple junction in
a region that was previously aseismic.
5 m slip. 120 km rupture. 30,000 killed. $20 billion in economic loss. 12 major (M > 6.7) events this century have
broken a total of 1000 km of the North Anatolian fault, including a 7.2 Mw aftershock on Nov. 12, 1999.
150 km south of Taipei. 2333 killed. 10,000 injured. >100,000 homeless. Extensive seismic monitoring in Taiwan
makes this one of the best seismically sampled earthquakes. One of largest observed surface thrust scarps.
(Armenia) earthquake killed 25,000. Even in Japan, where
modern construction practices are used to reduce earthquake
damage, the 1995 Kobe earthquake caused more than 5000
deaths and $100 billion of damage. On average during the
past century earthquakes have caused about 11,500 deaths per
year. As a result, earthquakes have had a significant effect upon
the history and culture of many regions.
The earthquake risk in the United States is much less than in
many other countries because large earthquakes are relatively
rare in most of the country and because of earthquake-resistant
construction. 4 The most seismically active area is southern
Alaska, a subduction zone subject to large earthquakes. However, the population there is relatively small, so the 1964 earthquake (the second largest ever recorded instrumentally) caused
far fewer deaths than a comparable earthquake would have in
Japan. The primary earthquake impact in recent years has been
in California. The 1994 Northridge earthquake killed 58 people and caused about $20 billion worth of damage in the Los
Angeles area, and the 1989 Loma Prieta earthquake that shook
the San Francisco area during a 1989 World Series baseball
game killed 63 people and did about $6 billion worth of
damage. Both these earthquakes were smaller (magnitude 6.8
and 7.1, respectively) than the largest known to occur on the
San Andreas fault, such as the 1906 San Francisco earthquake,
which had a magnitude of about 7.8.
Compared to other risks, earthquakes are not a major
cause of death or damage in the USA. Most earthquakes do
little harm, and even those felt in populated areas are commonly more of a nuisance than a catastrophe. Since 1811,
US earthquakes have claimed an average of nine lives per year
(Table 1.2-3), putting earthquakes at the level of in-line skating
4 Many seismologists have faced situations like explaining to apprehensive
telephone callers that the danger of earthquakes is small enough that the callers’
upcoming family vacations to Disneyland are not suicidal ventures.
Table 1.2-3 Some causes of death in the United States, 1996.
Cause of death
Number of deaths
Heart attack
733,834
Cancer
544,278
Stroke
160,431
Lung disease
106,143
Pneumonia/influenza
82,579
Diabetes
61,559
Motor vehicle accidents
43,300
AIDS
32,655
Suicide
30,862
Liver disease/cirrhosis
25,135
Kidney disease
24,391
Alzheimer’s
21,166
Homicide
20,738
Falling
14,100
Poison
10,400
Drowning
3,900
Fires
3,200
Suffocation
3,000
Bicycle accidents
695
Severe weather
1
514
In-line skating
2
25
Football 2
18
Skateboards
2
10
Earthquakes (1811–1983),
3 per year
9
Earthquakes (1984–98), per year
9
1 From the National Weather Service (property loss due to severe weather
is $10–15 billion/yr, comparable to the Northridge earthquake, and that
from individual hurricanes can go up to $25 billion).
2 From the Consumer Product Safety Commission.
3 From Gere and Shah (1984).
All others from the National Safety Council and National Center for
Health Statistics.
1.2 Seismology and society 13
Location and date
Strength Effects
Flores Island, Indonesia
7.8
December 12, 1992
M s
Northridge, CA
6.7
January 17, 1994
M w
Northern Bolivia
8.2
June 9, 1994
M s
Kobe, Japan
6.8
January 16, 1995
M s
NW of Balleny Islands
8.2
March 25, 1998
M w
Izmit, Turkey
7.4
August 17, 1999
M s
Chi-Chi, Taiwan
7.6
September 21, 1999
M w
Tsunami heights reached 25 m. Extensive shoreline damage, where tsunami run-up was up to 300 m.
2200 killed. 30,000 buildings destroyed.
Rupture on a blind thrust fault beneath Los Angeles. Many rock slides, ground cracks, and soil liquefaction.
58 killed. 7000 injured. 20,000 homeless. About $20 billion in damages.
Largest deep earthquake ever (depth was 637 km). Felt as far away as Canada.
5502 killed. 36,896 injured. 310,000 homeless. Massive destruction to world’s 3
rd largest seaport: 193,000
buildings, $100 billion in damages (highest to date).
Largest oceanic intraplate earthquake ever. Occurred west of Australia–Pacific–Antarctic plate triple junction in
a region that was previously aseismic.
5 m slip. 120 km rupture. 30,000 killed. $20 billion in economic loss. 12 major (M > 6.7) events this century have
broken a total of 1000 km of the North Anatolian fault, including a 7.2 Mw aftershock on Nov. 12, 1999.
150 km south of Taipei. 2333 killed. 10,000 injured. >100,000 homeless. Extensive seismic monitoring in Taiwan
makes this one of the best seismically sampled earthquakes. One of largest observed surface thrust scarps.
(Armenia) earthquake killed 25,000. Even in Japan, where
modern construction practices are used to reduce earthquake
damage, the 1995 Kobe earthquake caused more than 5000
deaths and $100 billion of damage. On average during the
past century earthquakes have caused about 11,500 deaths per
year. As a result, earthquakes have had a significant effect upon
the history and culture of many regions.
The earthquake risk in the United States is much less than in
many other countries because large earthquakes are relatively
rare in most of the country and because of earthquake-resistant
construction. 4 The most seismically active area is southern
Alaska, a subduction zone subject to large earthquakes. However, the population there is relatively small, so the 1964 earthquake (the second largest ever recorded instrumentally) caused
far fewer deaths than a comparable earthquake would have in
Japan. The primary earthquake impact in recent years has been
in California. The 1994 Northridge earthquake killed 58 people and caused about $20 billion worth of damage in the Los
Angeles area, and the 1989 Loma Prieta earthquake that shook
the San Francisco area during a 1989 World Series baseball
game killed 63 people and did about $6 billion worth of
damage. Both these earthquakes were smaller (magnitude 6.8
and 7.1, respectively) than the largest known to occur on the
San Andreas fault, such as the 1906 San Francisco earthquake,
which had a magnitude of about 7.8.
Compared to other risks, earthquakes are not a major
cause of death or damage in the USA. Most earthquakes do
little harm, and even those felt in populated areas are commonly more of a nuisance than a catastrophe. Since 1811,
US earthquakes have claimed an average of nine lives per year
(Table 1.2-3), putting earthquakes at the level of in-line skating
4 Many seismologists have faced situations like explaining to apprehensive
telephone callers that the danger of earthquakes is small enough that the callers’
upcoming family vacations to Disneyland are not suicidal ventures.
Table 1.2-3 Some causes of death in the United States, 1996.
Cause of death
Number of deaths
Heart attack
733,834
Cancer
544,278
Stroke
160,431
Lung disease
106,143
Pneumonia/influenza
82,579
Diabetes
61,559
Motor vehicle accidents
43,300
AIDS
32,655
Suicide
30,862
Liver disease/cirrhosis
25,135
Kidney disease
24,391
Alzheimer’s
21,166
Homicide
20,738
Falling
14,100
Poison
10,400
Drowning
3,900
Fires
3,200
Suffocation
3,000
Bicycle accidents
695
Severe weather
1
514
In-line skating
2
25
Football 2
18
Skateboards
2
10
Earthquakes (1811–1983),
3 per year
9
Earthquakes (1984–98), per year
9
1 From the National Weather Service (property loss due to severe weather
is $10–15 billion/yr, comparable to the Northridge earthquake, and that
from individual hurricanes can go up to $25 billion).
2 From the Consumer Product Safety Commission.
3 From Gere and Shah (1984).
All others from the National Safety Council and National Center for
Health Statistics.
1.2 Seismology and society 13