

Stations
Time (min)
Distance (°)
120
140
160
180
20
19
D
F A
B
A
B
F
C
C
D
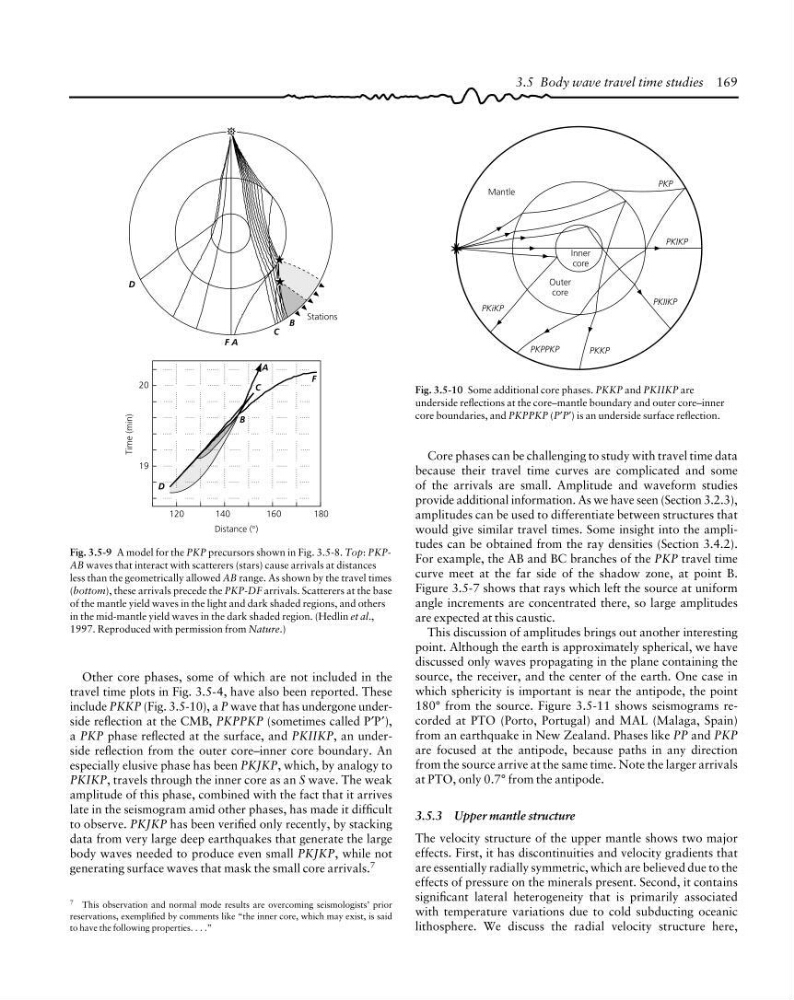
Fig. 3.5-9 A model for the PKP precursors shown in Fig. 3.5-8. Top: PKPAB waves that interact with scatterers (stars) cause arrivals at distances
less than the geometrically allowed AB range. As shown by the travel times
(bottom), these arrivals precede the PKP-DF arrivals. Scatterers at the base
of the mantle yield waves in the light and dark shaded regions, and others
in the mid-mantle yield waves in the dark shaded region. (Hedlin et al.,
1997. Reproduced with permission from Nature.)
7 This observation and normal mode results are overcoming seismologists’ prior
reservations, exemplified by comments like “the inner core, which may exist, is said
to have the following properties. . . .”
Other core phases, some of which are not included in the
travel time plots in Fig. 3.5-4, have also been reported. These
include PKKP (Fig. 3.5-10), a P wave that has undergone underside reflection at the CMB, PKPPKP (sometimes called P′P′),
a PKP phase reflected at the surface, and PKIIKP, an underside reflection from the outer core–inner core boundary. An
especially elusive phase has been PKJKP, which, by analogy to
PKIKP, travels through the inner core as an S wave. The weak
amplitude of this phase, combined with the fact that it arrives
late in the seismogram amid other phases, has made it difficult
to observe. PKJKP has been verified only recently, by stacking
data from very large deep earthquakes that generate the large
body waves needed to produce even small PKJKP, while not
generating surface waves that mask the small core arrivals. 7
Inner
core
Outer
core
Mantle
PKP
PKIKP
PKIIKP
PKKP
PKPPKP
PKiKP
Fig. 3.5-10 Some additional core phases. PKKP and PKIIKP are
underside reflections at the core–mantle boundary and outer core–inner
core boundaries, and PKPPKP (P′P′) is an underside surface reflection.
3.5 Body wave travel time studies 169
Core phases can be challenging to study with travel time data
because their travel time curves are complicated and some
of the arrivals are small. Amplitude and waveform studies
provide additional information. As we have seen (Section 3.2.3),
amplitudes can be used to differentiate between structures that
would give similar travel times. Some insight into the amplitudes can be obtained from the ray densities (Section 3.4.2).
For example, the AB and BC branches of the PKP travel time
curve meet at the far side of the shadow zone, at point B.
Figure 3.5-7 shows that rays which left the source at uniform
angle increments are concentrated there, so large amplitudes
are expected at this caustic.
This discussion of amplitudes brings out another interesting
point. Although the earth is approximately spherical, we have
discussed only waves propagating in the plane containing the
source, the receiver, and the center of the earth. One case in
which sphericity is important is near the antipode, the point
180° from the source. Figure 3.5-11 shows seismograms recorded at PTO (Porto, Portugal) and MAL (Malaga, Spain)
from an earthquake in New Zealand. Phases like PP and PKP
are focused at the antipode, because paths in any direction
from the source arrive at the same time. Note the larger arrivals
at PTO, only 0.7° from the antipode.
3.5.3 Upper mantle structure
The velocity structure of the upper mantle shows two major
effects. First, it has discontinuities and velocity gradients that
are essentially radially symmetric, which are believed due to the
effects of pressure on the minerals present. Second, it contains
significant lateral heterogeneity that is primarily associated
with temperature variations due to cold subducting oceanic
lithosphere. We discuss the radial velocity structure here,
Time (min)
Distance (°)
120
140
160
180
20
19
D
F A
B
A
B
F
C
C
D
Fig. 3.5-9 A model for the PKP precursors shown in Fig. 3.5-8. Top: PKPAB waves that interact with scatterers (stars) cause arrivals at distances
less than the geometrically allowed AB range. As shown by the travel times
(bottom), these arrivals precede the PKP-DF arrivals. Scatterers at the base
of the mantle yield waves in the light and dark shaded regions, and others
in the mid-mantle yield waves in the dark shaded region. (Hedlin et al.,
1997. Reproduced with permission from Nature.)
7 This observation and normal mode results are overcoming seismologists’ prior
reservations, exemplified by comments like “the inner core, which may exist, is said
to have the following properties. . . .”
Other core phases, some of which are not included in the
travel time plots in Fig. 3.5-4, have also been reported. These
include PKKP (Fig. 3.5-10), a P wave that has undergone underside reflection at the CMB, PKPPKP (sometimes called P′P′),
a PKP phase reflected at the surface, and PKIIKP, an underside reflection from the outer core–inner core boundary. An
especially elusive phase has been PKJKP, which, by analogy to
PKIKP, travels through the inner core as an S wave. The weak
amplitude of this phase, combined with the fact that it arrives
late in the seismogram amid other phases, has made it difficult
to observe. PKJKP has been verified only recently, by stacking
data from very large deep earthquakes that generate the large
body waves needed to produce even small PKJKP, while not
generating surface waves that mask the small core arrivals. 7
Inner
core
Outer
core
Mantle
PKP
PKIKP
PKIIKP
PKKP
PKPPKP
PKiKP
Fig. 3.5-10 Some additional core phases. PKKP and PKIIKP are
underside reflections at the core–mantle boundary and outer core–inner
core boundaries, and PKPPKP (P′P′) is an underside surface reflection.
3.5 Body wave travel time studies 169
Core phases can be challenging to study with travel time data
because their travel time curves are complicated and some
of the arrivals are small. Amplitude and waveform studies
provide additional information. As we have seen (Section 3.2.3),
amplitudes can be used to differentiate between structures that
would give similar travel times. Some insight into the amplitudes can be obtained from the ray densities (Section 3.4.2).
For example, the AB and BC branches of the PKP travel time
curve meet at the far side of the shadow zone, at point B.
Figure 3.5-7 shows that rays which left the source at uniform
angle increments are concentrated there, so large amplitudes
are expected at this caustic.
This discussion of amplitudes brings out another interesting
point. Although the earth is approximately spherical, we have
discussed only waves propagating in the plane containing the
source, the receiver, and the center of the earth. One case in
which sphericity is important is near the antipode, the point
180° from the source. Figure 3.5-11 shows seismograms recorded at PTO (Porto, Portugal) and MAL (Malaga, Spain)
from an earthquake in New Zealand. Phases like PP and PKP
are focused at the antipode, because paths in any direction
from the source arrive at the same time. Note the larger arrivals
at PTO, only 0.7° from the antipode.
3.5.3 Upper mantle structure
The velocity structure of the upper mantle shows two major
effects. First, it has discontinuities and velocity gradients that
are essentially radially symmetric, which are believed due to the
effects of pressure on the minerals present. Second, it contains
significant lateral heterogeneity that is primarily associated
with temperature variations due to cold subducting oceanic
lithosphere. We discuss the radial velocity structure here,