

78
P. Lazo et al.
45
40
35
30
25
20
15
10
5
1
350
300
250
200
150
100
50
0
MAPE
42.82
MAD
33.12
MSD
2671.95
Accuracy Measures
n
N a
Actual
Fits
Variable
Spatial Analysis Plot for Na
Linear Trend Model
Na = 114 - 0.629×n
45
40
35
30
25
20
15
10
5
1
1000
800
600
400
200
0
MAPE
82.4
MAD
141.1
MSD
37334.9
Accuracy Measures
n
Cl
Actual
Fits
Variable
Trend Analysis Plot for Cl
Linear Trend Model
Cl = 331 - 3.66×n
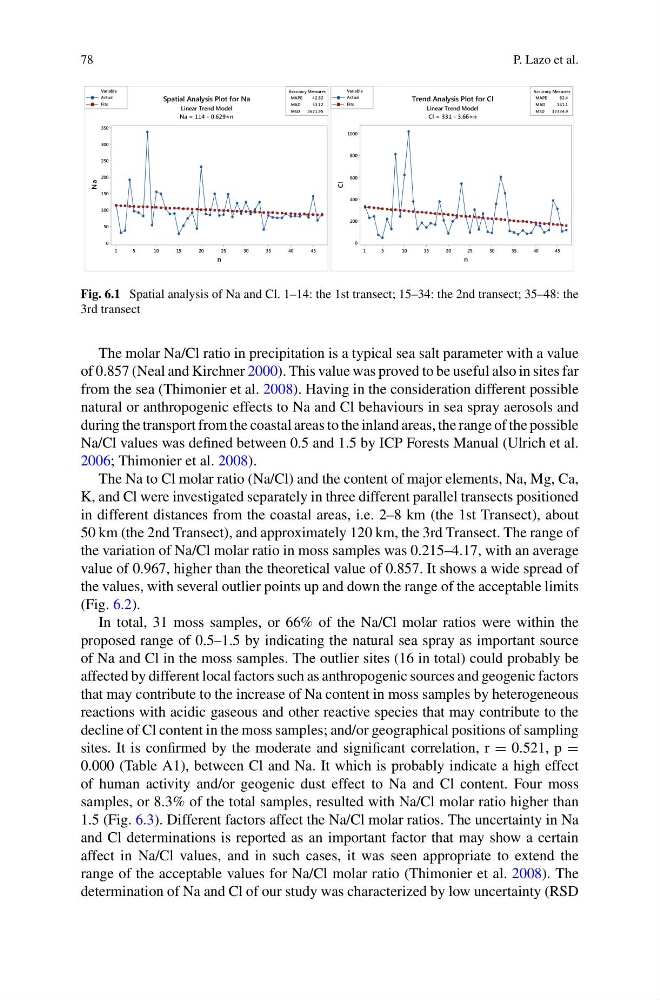
Fig. 6.1 Spatial analysis of Na and Cl. 1–14: the 1st transect; 15–34: the 2nd transect; 35–48: the
3rd transect
The molar Na/Cl ratio in precipitation is a typical sea salt parameter with a value
of 0.857 (Neal and Kirchner 2000). This value was proved to be useful also in sites far
from the sea (Thimonier et al. 2008). Having in the consideration different possible
natural or anthropogenic effects to Na and Cl behaviours in sea spray aerosols and
during the transport from the coastal areas to the inland areas, the range of the possible
Na/Cl values was defined between 0.5 and 1.5 by ICP Forests Manual (Ulrich et al.
2006; Thimonier et al. 2008).
The Na to Cl molar ratio (Na/Cl) and the content of major elements, Na, Mg, Ca,
K, and Cl were investigated separately in three different parallel transects positioned
in different distances from the coastal areas, i.e. 2–8 km (the 1st Transect), about
50 km (the 2nd Transect), and approximately 120 km, the 3rd Transect. The range of
the variation of Na/Cl molar ratio in moss samples was 0.215–4.17, with an average
value of 0.967, higher than the theoretical value of 0.857. It shows a wide spread of
the values, with several outlier points up and down the range of the acceptable limits
(Fig. 6.2).
In total, 31 moss samples, or 66% of the Na/Cl molar ratios were within the
proposed range of 0.5–1.5 by indicating the natural sea spray as important source
of Na and Cl in the moss samples. The outlier sites (16 in total) could probably be
affected by different local factors such as anthropogenic sources and geogenic factors
that may contribute to the increase of Na content in moss samples by heterogeneous
reactions with acidic gaseous and other reactive species that may contribute to the
decline of Cl content in the moss samples; and/or geographical positions of sampling
sites. It is confirmed by the moderate and significant correlation, r = 0.521, p =
0.000 (Table A1), between Cl and Na. It which is probably indicate a high effect
of human activity and/or geogenic dust effect to Na and Cl content. Four moss
samples, or 8.3% of the total samples, resulted with Na/Cl molar ratio higher than
1.5 (Fig. 6.3). Different factors affect the Na/Cl molar ratios. The uncertainty in Na
and Cl determinations is reported as an important factor that may show a certain
affect in Na/Cl values, and in such cases, it was seen appropriate to extend the
range of the acceptable values for Na/Cl molar ratio (Thimonier et al. 2008). The
determination of Na and Cl of our study was characterized by low uncertainty (RSD
P. Lazo et al.
45
40
35
30
25
20
15
10
5
1
350
300
250
200
150
100
50
0
MAPE
42.82
MAD
33.12
MSD
2671.95
Accuracy Measures
n
N a
Actual
Fits
Variable
Spatial Analysis Plot for Na
Linear Trend Model
Na = 114 - 0.629×n
45
40
35
30
25
20
15
10
5
1
1000
800
600
400
200
0
MAPE
82.4
MAD
141.1
MSD
37334.9
Accuracy Measures
n
Cl
Actual
Fits
Variable
Trend Analysis Plot for Cl
Linear Trend Model
Cl = 331 - 3.66×n
Fig. 6.1 Spatial analysis of Na and Cl. 1–14: the 1st transect; 15–34: the 2nd transect; 35–48: the
3rd transect
The molar Na/Cl ratio in precipitation is a typical sea salt parameter with a value
of 0.857 (Neal and Kirchner 2000). This value was proved to be useful also in sites far
from the sea (Thimonier et al. 2008). Having in the consideration different possible
natural or anthropogenic effects to Na and Cl behaviours in sea spray aerosols and
during the transport from the coastal areas to the inland areas, the range of the possible
Na/Cl values was defined between 0.5 and 1.5 by ICP Forests Manual (Ulrich et al.
2006; Thimonier et al. 2008).
The Na to Cl molar ratio (Na/Cl) and the content of major elements, Na, Mg, Ca,
K, and Cl were investigated separately in three different parallel transects positioned
in different distances from the coastal areas, i.e. 2–8 km (the 1st Transect), about
50 km (the 2nd Transect), and approximately 120 km, the 3rd Transect. The range of
the variation of Na/Cl molar ratio in moss samples was 0.215–4.17, with an average
value of 0.967, higher than the theoretical value of 0.857. It shows a wide spread of
the values, with several outlier points up and down the range of the acceptable limits
(Fig. 6.2).
In total, 31 moss samples, or 66% of the Na/Cl molar ratios were within the
proposed range of 0.5–1.5 by indicating the natural sea spray as important source
of Na and Cl in the moss samples. The outlier sites (16 in total) could probably be
affected by different local factors such as anthropogenic sources and geogenic factors
that may contribute to the increase of Na content in moss samples by heterogeneous
reactions with acidic gaseous and other reactive species that may contribute to the
decline of Cl content in the moss samples; and/or geographical positions of sampling
sites. It is confirmed by the moderate and significant correlation, r = 0.521, p =
0.000 (Table A1), between Cl and Na. It which is probably indicate a high effect
of human activity and/or geogenic dust effect to Na and Cl content. Four moss
samples, or 8.3% of the total samples, resulted with Na/Cl molar ratio higher than
1.5 (Fig. 6.3). Different factors affect the Na/Cl molar ratios. The uncertainty in Na
and Cl determinations is reported as an important factor that may show a certain
affect in Na/Cl values, and in such cases, it was seen appropriate to extend the
range of the acceptable values for Na/Cl molar ratio (Thimonier et al. 2008). The
determination of Na and Cl of our study was characterized by low uncertainty (RSD