

16
P. Lazo et al.
et al. 2018). The mean content of Hg (0.036 ± 0.012 mg kg
−1 , DW) is in good
agreement with the mean certified value (0.038 mg kg
−1 , DW). The recovery of the
investigated elements was checked by standard addition method. It ranged between
98.5 and 101.2% for ICP-AES, and 96.9–103.2% for AAS. Differences between the
mean contents of Hg from the respective certified values of reference material were
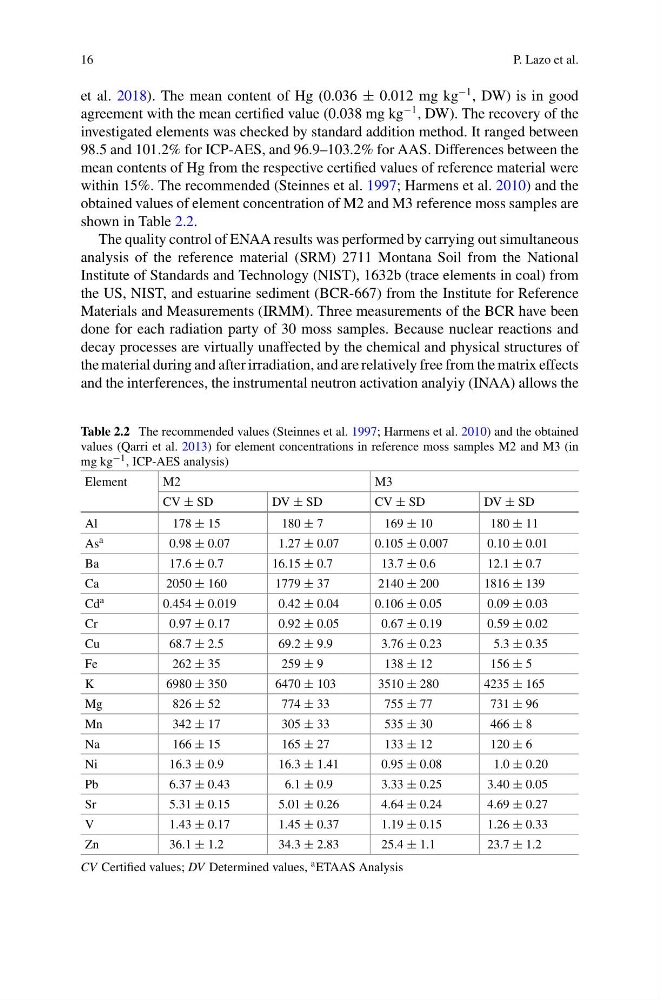
within 15%. The recommended (Steinnes et al. 1997; Harmens et al. 2010) and the
obtained values of element concentration of M2 and M3 reference moss samples are
shown in Table 2.2.
The quality control of ENAA results was performed by carrying out simultaneous
analysis of the reference material (SRM) 2711 Montana Soil from the National
Institute of Standards and Technology (NIST), 1632b (trace elements in coal) from
the US, NIST, and estuarine sediment (BCR-667) from the Institute for Reference
Materials and Measurements (IRMM). Three measurements of the BCR have been
done for each radiation party of 30 moss samples. Because nuclear reactions and
decay processes are virtually unaffected by the chemical and physical structures of
the material during and after irradiation, and are relatively free from the matrix effects
and the interferences, the instrumental neutron activation analyiy (INAA) allows the
Table 2.2 The recommended values (Steinnes et al. 1997; Harmens et al. 2010) and the obtained
values (Qarri et al. 2013) for element concentrations in reference moss samples M2 and M3 (in
mg kg −1 , ICP-AES analysis)
Element
M2
M3
CV ± SD
DV ± SD
CV ± SD
DV ± SD
Al
178 ± 15
180 ± 7
169 ± 10
180 ± 11
As a
0.98 ± 0.07
1.27 ± 0.07
0.105 ± 0.007
0.10 ± 0.01
Ba
17.6 ± 0.7
16.15 ± 0.7
13.7 ± 0.6
12.1 ± 0.7
Ca
2050 ± 160
1779 ± 37
2140 ± 200
1816 ± 139
Cd a
0.454 ± 0.019
0.42 ± 0.04
0.106 ± 0.05
0.09 ± 0.03
Cr
0.97 ± 0.17
0.92 ± 0.05
0.67 ± 0.19
0.59 ± 0.02
Cu
68.7 ± 2.5
69.2 ± 9.9
3.76 ± 0.23
5.3 ± 0.35
Fe
262 ± 35
259 ± 9
138 ± 12
156 ± 5
K
6980 ± 350
6470 ± 103
3510 ± 280
4235 ± 165
Mg
826 ± 52
774 ± 33
755 ± 77
731 ± 96
Mn
342 ± 17
305 ± 33
535 ± 30
466 ± 8
Na
166 ± 15
165 ± 27
133 ± 12
120 ± 6
Ni
16.3 ± 0.9
16.3 ± 1.41
0.95 ± 0.08
1.0 ± 0.20
Pb
6.37 ± 0.43
6.1 ± 0.9
3.33 ± 0.25
3.40 ± 0.05
Sr
5.31 ± 0.15
5.01 ± 0.26
4.64 ± 0.24
4.69 ± 0.27
V
1.43 ± 0.17
1.45 ± 0.37
1.19 ± 0.15
1.26 ± 0.33
Zn
36.1 ± 1.2
34.3 ± 2.83
25.4 ± 1.1
23.7 ± 1.2
CV Certified values; DV Determined values, a ETAAS Analysis
P. Lazo et al.
et al. 2018). The mean content of Hg (0.036 ± 0.012 mg kg
−1 , DW) is in good
agreement with the mean certified value (0.038 mg kg
−1 , DW). The recovery of the
investigated elements was checked by standard addition method. It ranged between
98.5 and 101.2% for ICP-AES, and 96.9–103.2% for AAS. Differences between the
mean contents of Hg from the respective certified values of reference material were
within 15%. The recommended (Steinnes et al. 1997; Harmens et al. 2010) and the
obtained values of element concentration of M2 and M3 reference moss samples are
shown in Table 2.2.
The quality control of ENAA results was performed by carrying out simultaneous
analysis of the reference material (SRM) 2711 Montana Soil from the National
Institute of Standards and Technology (NIST), 1632b (trace elements in coal) from
the US, NIST, and estuarine sediment (BCR-667) from the Institute for Reference
Materials and Measurements (IRMM). Three measurements of the BCR have been
done for each radiation party of 30 moss samples. Because nuclear reactions and
decay processes are virtually unaffected by the chemical and physical structures of
the material during and after irradiation, and are relatively free from the matrix effects
and the interferences, the instrumental neutron activation analyiy (INAA) allows the
Table 2.2 The recommended values (Steinnes et al. 1997; Harmens et al. 2010) and the obtained
values (Qarri et al. 2013) for element concentrations in reference moss samples M2 and M3 (in
mg kg −1 , ICP-AES analysis)
Element
M2
M3
CV ± SD
DV ± SD
CV ± SD
DV ± SD
Al
178 ± 15
180 ± 7
169 ± 10
180 ± 11
As a
0.98 ± 0.07
1.27 ± 0.07
0.105 ± 0.007
0.10 ± 0.01
Ba
17.6 ± 0.7
16.15 ± 0.7
13.7 ± 0.6
12.1 ± 0.7
Ca
2050 ± 160
1779 ± 37
2140 ± 200
1816 ± 139
Cd a
0.454 ± 0.019
0.42 ± 0.04
0.106 ± 0.05
0.09 ± 0.03
Cr
0.97 ± 0.17
0.92 ± 0.05
0.67 ± 0.19
0.59 ± 0.02
Cu
68.7 ± 2.5
69.2 ± 9.9
3.76 ± 0.23
5.3 ± 0.35
Fe
262 ± 35
259 ± 9
138 ± 12
156 ± 5
K
6980 ± 350
6470 ± 103
3510 ± 280
4235 ± 165
Mg
826 ± 52
774 ± 33
755 ± 77
731 ± 96
Mn
342 ± 17
305 ± 33
535 ± 30
466 ± 8
Na
166 ± 15
165 ± 27
133 ± 12
120 ± 6
Ni
16.3 ± 0.9
16.3 ± 1.41
0.95 ± 0.08
1.0 ± 0.20
Pb
6.37 ± 0.43
6.1 ± 0.9
3.33 ± 0.25
3.40 ± 0.05
Sr
5.31 ± 0.15
5.01 ± 0.26
4.64 ± 0.24
4.69 ± 0.27
V
1.43 ± 0.17
1.45 ± 0.37
1.19 ± 0.15
1.26 ± 0.33
Zn
36.1 ± 1.2
34.3 ± 2.83
25.4 ± 1.1
23.7 ± 1.2
CV Certified values; DV Determined values, a ETAAS Analysis