

2 The Methodology of the Study
13
2.2.2 Sample Preparation and Chemical Analysis
The cleaned green and green-brownish parts of the moss (H. cupressiforme (Hedv.)
sps.) that represent the last 3 years of moss growth, were selected for analysis.
Unwashed green and greenish-brown parts of the moss were cleaned from the
adhering materials to the surface of the samples such as tree bark, lichens, soil dust,
and the dead materials. The samples were dried to constant weight for 48 h at 30–
35 °C. To reduce the particle size and satisfy the conditions for homogeneity of the
sample, the samples were ground and homogenized prior to the analysis using a
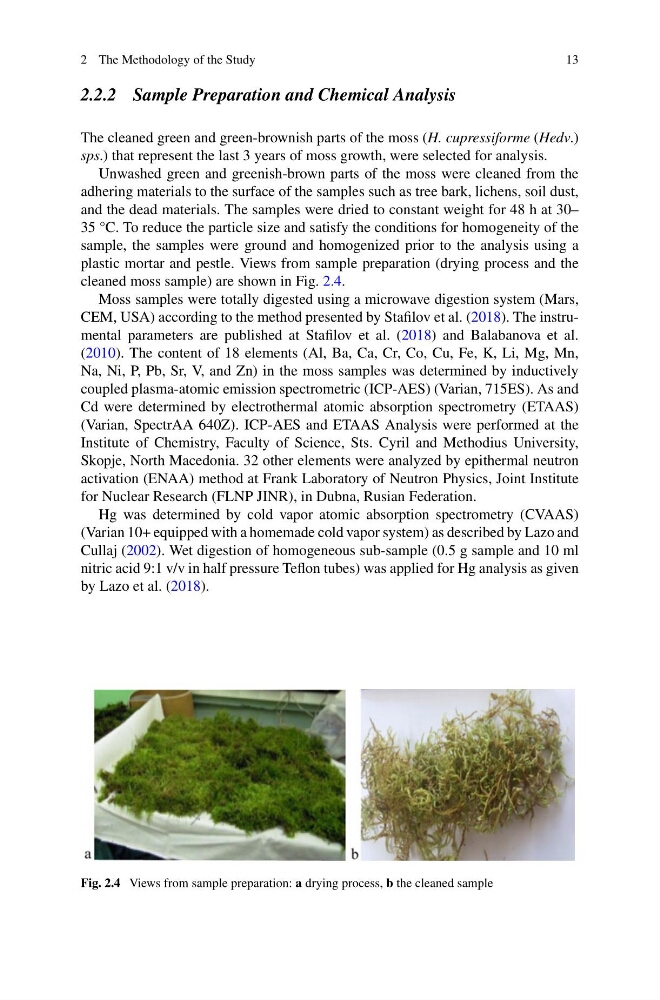
plastic mortar and pestle. Views from sample preparation (drying process and the
cleaned moss sample) are shown in Fig. 2.4.
Moss samples were totally digested using a microwave digestion system (Mars,
CEM, USA) according to the method presented by Stafilov et al. (2018). The instrumental parameters are published at Stafilov et al. (2018) and Balabanova et al.
(2010). The content of 18 elements (Al, Ba, Ca, Cr, Co, Cu, Fe, K, Li, Mg, Mn,
Na, Ni, P, Pb, Sr, V, and Zn) in the moss samples was determined by inductively
coupled plasma-atomic emission spectrometric (ICP-AES) (Varian, 715ES). As and
Cd were determined by electrothermal atomic absorption spectrometry (ETAAS)
(Varian, SpectrAA 640Z). ICP-AES and ETAAS Analysis were performed at the
Institute of Chemistry, Faculty of Science, Sts. Cyril and Methodius University,
Skopje, North Macedonia. 32 other elements were analyzed by epithermal neutron
activation (ENAA) method at Frank Laboratory of Neutron Physics, Joint Institute
for Nuclear Research (FLNP JINR), in Dubna, Rusian Federation.
Hg was determined by cold vapor atomic absorption spectrometry (CVAAS)
(Varian 10+ equipped with a homemade cold vapor system) as described by Lazo and
Cullaj (2002). Wet digestion of homogeneous sub-sample (0.5 g sample and 10 ml
nitric acid 9:1 v/v in half pressure Teflon tubes) was applied for Hg analysis as given
by Lazo et al. (2018).
Fig. 2.4 Views from sample preparation: a drying process, b the cleaned sample
13
2.2.2 Sample Preparation and Chemical Analysis
The cleaned green and green-brownish parts of the moss (H. cupressiforme (Hedv.)
sps.) that represent the last 3 years of moss growth, were selected for analysis.
Unwashed green and greenish-brown parts of the moss were cleaned from the
adhering materials to the surface of the samples such as tree bark, lichens, soil dust,
and the dead materials. The samples were dried to constant weight for 48 h at 30–
35 °C. To reduce the particle size and satisfy the conditions for homogeneity of the
sample, the samples were ground and homogenized prior to the analysis using a
plastic mortar and pestle. Views from sample preparation (drying process and the
cleaned moss sample) are shown in Fig. 2.4.
Moss samples were totally digested using a microwave digestion system (Mars,
CEM, USA) according to the method presented by Stafilov et al. (2018). The instrumental parameters are published at Stafilov et al. (2018) and Balabanova et al.
(2010). The content of 18 elements (Al, Ba, Ca, Cr, Co, Cu, Fe, K, Li, Mg, Mn,
Na, Ni, P, Pb, Sr, V, and Zn) in the moss samples was determined by inductively
coupled plasma-atomic emission spectrometric (ICP-AES) (Varian, 715ES). As and
Cd were determined by electrothermal atomic absorption spectrometry (ETAAS)
(Varian, SpectrAA 640Z). ICP-AES and ETAAS Analysis were performed at the
Institute of Chemistry, Faculty of Science, Sts. Cyril and Methodius University,
Skopje, North Macedonia. 32 other elements were analyzed by epithermal neutron
activation (ENAA) method at Frank Laboratory of Neutron Physics, Joint Institute
for Nuclear Research (FLNP JINR), in Dubna, Rusian Federation.
Hg was determined by cold vapor atomic absorption spectrometry (CVAAS)
(Varian 10+ equipped with a homemade cold vapor system) as described by Lazo and
Cullaj (2002). Wet digestion of homogeneous sub-sample (0.5 g sample and 10 ml
nitric acid 9:1 v/v in half pressure Teflon tubes) was applied for Hg analysis as given
by Lazo et al. (2018).
Fig. 2.4 Views from sample preparation: a drying process, b the cleaned sample