

8 Multivariate Analysis
95
a.
45
40
35
30
25
20
15
10
5
1
2.5
2.0
1.5
1.0
0.5
MAPE 37.0564
MAD
0.3365
MSD
0.1831
Accuracy Measures
n
F5
Actual
Fits
Variable
Spatial Analysis Plot for F5
Linear Trend Model
F = 1.082 - 0.00668×n
b.
45
40
35
30
25
20
15
10
5
1
4.0
3.5
3.0
2.5
2.0
1.5
1.0
0.5
MAPE 28.8460
MAD
0.3044
MSD
0.2237
Accuracy Measures
n
F6
Actual
Fits
Variable
Spatial Analysis Plot for F6
Linear Trend Model
F6 = 1.384 - 0.01128×n
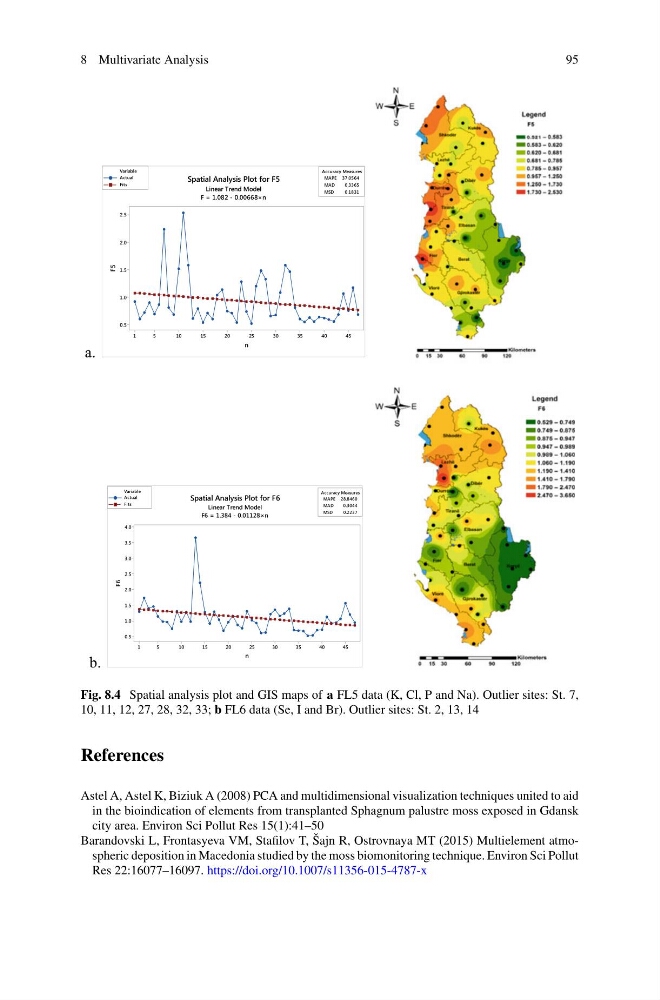
Fig. 8.4 Spatial analysis plot and GIS maps of a FL5 data (K, Cl, P and Na). Outlier sites: St. 7,
10, 11, 12, 27, 28, 32, 33; b FL6 data (Se, I and Br). Outlier sites: St. 2, 13, 14
References
Astel A, Astel K, Biziuk A (2008) PCA and multidimensional visualization techniques united to aid
in the bioindication of elements from transplanted Sphagnum palustre moss exposed in Gdansk
city area. Environ Sci Pollut Res 15(1):41–50
Barandovski L, Frontasyeva VM, Stafilov T, Šajn R, Ostrovnaya MT (2015) Multielement atmospheric deposition in Macedonia studied by the moss biomonitoring technique. Environ Sci Pollut
Res 22:16077–16097. https://doi.org/10.1007/s11356-015-4787-x
95
a.
45
40
35
30
25
20
15
10
5
1
2.5
2.0
1.5
1.0
0.5
MAPE 37.0564
MAD
0.3365
MSD
0.1831
Accuracy Measures
n
F5
Actual
Fits
Variable
Spatial Analysis Plot for F5
Linear Trend Model
F = 1.082 - 0.00668×n
b.
45
40
35
30
25
20
15
10
5
1
4.0
3.5
3.0
2.5
2.0
1.5
1.0
0.5
MAPE 28.8460
MAD
0.3044
MSD
0.2237
Accuracy Measures
n
F6
Actual
Fits
Variable
Spatial Analysis Plot for F6
Linear Trend Model
F6 = 1.384 - 0.01128×n
Fig. 8.4 Spatial analysis plot and GIS maps of a FL5 data (K, Cl, P and Na). Outlier sites: St. 7,
10, 11, 12, 27, 28, 32, 33; b FL6 data (Se, I and Br). Outlier sites: St. 2, 13, 14
References
Astel A, Astel K, Biziuk A (2008) PCA and multidimensional visualization techniques united to aid
in the bioindication of elements from transplanted Sphagnum palustre moss exposed in Gdansk
city area. Environ Sci Pollut Res 15(1):41–50
Barandovski L, Frontasyeva VM, Stafilov T, Šajn R, Ostrovnaya MT (2015) Multielement atmospheric deposition in Macedonia studied by the moss biomonitoring technique. Environ Sci Pollut
Res 22:16077–16097. https://doi.org/10.1007/s11356-015-4787-x