

Industrial Water Footprint: Case Study on Textile Industries
55
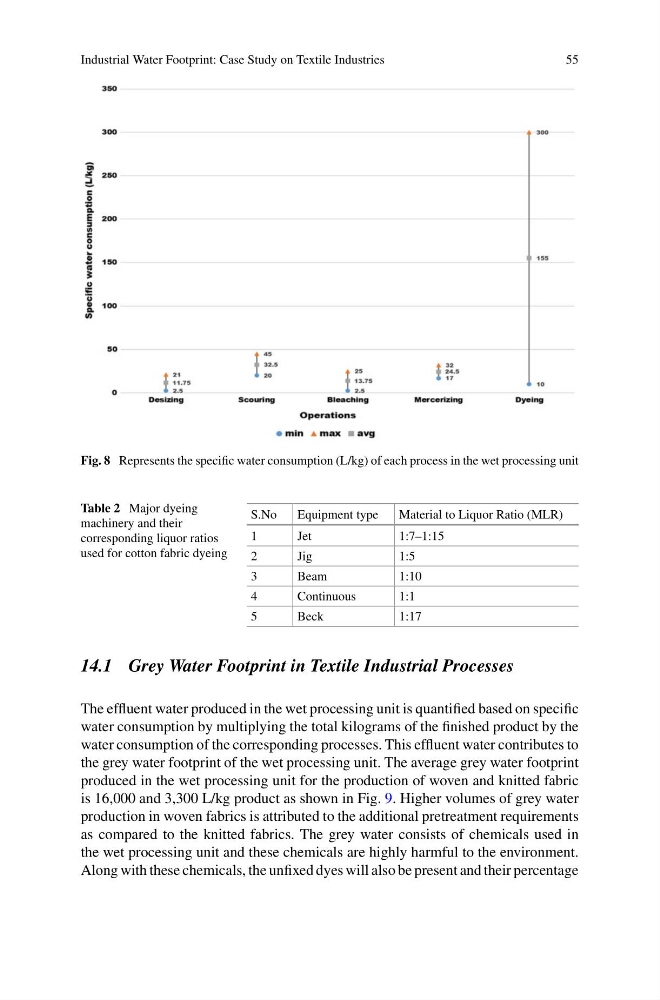
Fig. 8 Represents the specific water consumption (L/kg) of each process in the wet processing unit
Table 2 Major dyeing
machinery and their
corresponding liquor ratios
used for cotton fabric dyeing
S.No
Equipment type
Material to Liquor Ratio (MLR)
1
Jet
1:7–1:15
2
Jig
1:5
3
Beam
1:10
4
Continuous
1:1
5
Beck
1:17
14.1 Grey Water Footprint in Textile Industrial Processes
The effluent water produced in the wet processing unit is quantified based on specific
water consumption by multiplying the total kilograms of the finished product by the
water consumption of the corresponding processes. This effluent water contributes to
the grey water footprint of the wet processing unit. The average grey water footprint
produced in the wet processing unit for the production of woven and knitted fabric
is 16,000 and 3,300 L/kg product as shown in Fig. 9. Higher volumes of grey water
production in woven fabrics is attributed to the additional pretreatment requirements
as compared to the knitted fabrics. The grey water consists of chemicals used in
the wet processing unit and these chemicals are highly harmful to the environment.
Along with these chemicals, the unfixed dyes will also be present and their percentage
55
Fig. 8 Represents the specific water consumption (L/kg) of each process in the wet processing unit
Table 2 Major dyeing
machinery and their
corresponding liquor ratios
used for cotton fabric dyeing
S.No
Equipment type
Material to Liquor Ratio (MLR)
1
Jet
1:7–1:15
2
Jig
1:5
3
Beam
1:10
4
Continuous
1:1
5
Beck
1:17
14.1 Grey Water Footprint in Textile Industrial Processes
The effluent water produced in the wet processing unit is quantified based on specific
water consumption by multiplying the total kilograms of the finished product by the
water consumption of the corresponding processes. This effluent water contributes to
the grey water footprint of the wet processing unit. The average grey water footprint
produced in the wet processing unit for the production of woven and knitted fabric
is 16,000 and 3,300 L/kg product as shown in Fig. 9. Higher volumes of grey water
production in woven fabrics is attributed to the additional pretreatment requirements
as compared to the knitted fabrics. The grey water consists of chemicals used in
the wet processing unit and these chemicals are highly harmful to the environment.
Along with these chemicals, the unfixed dyes will also be present and their percentage