

Verifiable Water Use Inventory Using ICT …
27
The real use of irrigation water (recorded on the water meter) in the 2019 campaign
was 497 mm, which is the same as the recommended amount. But the irrigation
management done by the farmer (Fig. 7b) differs from the programming obtained
with the proposed methodology. Irrigation is less frequent and longer. This affects
the evolution of soil moisture, which is significantly different from that predicted
with the recommended optimal schedule. During the months of June and July (DOY
153-214), the longer duration and frequency of irrigation events keep the moisture
content in the soil at values close to and above FC, indicating that water use is not
optimal. With all this, the actual ER calculated for this year was 238 mm.
3.1.2 Irrigation Management of the Greenhouse Tomatoes
The objective of irrigation management in greenhouse crops (e.g. the tomato crop
described in Sect. 2.1) is to estimate the needs of the crop to determine how much
water and when it should be applied.
In the case of the greenhouse tomato study, there is no pre-established water
allocation (Fig. 3). This circumstance avoids the application of irrigation strategies
and since the soil’s water storage capacity is not considered in this type of crop,
irrigation programming is only conditioned by the crop’s evapotranspiration.
The crop was developed, in the 2019/2020 campaign, from August 20, 2019
to May 25, 2020. Because water meters were installed after the crop was planted,
only water inputs were monitored during the cultivation period, without taking into
account previous applications for soil preparation. In this case, the soil moisture
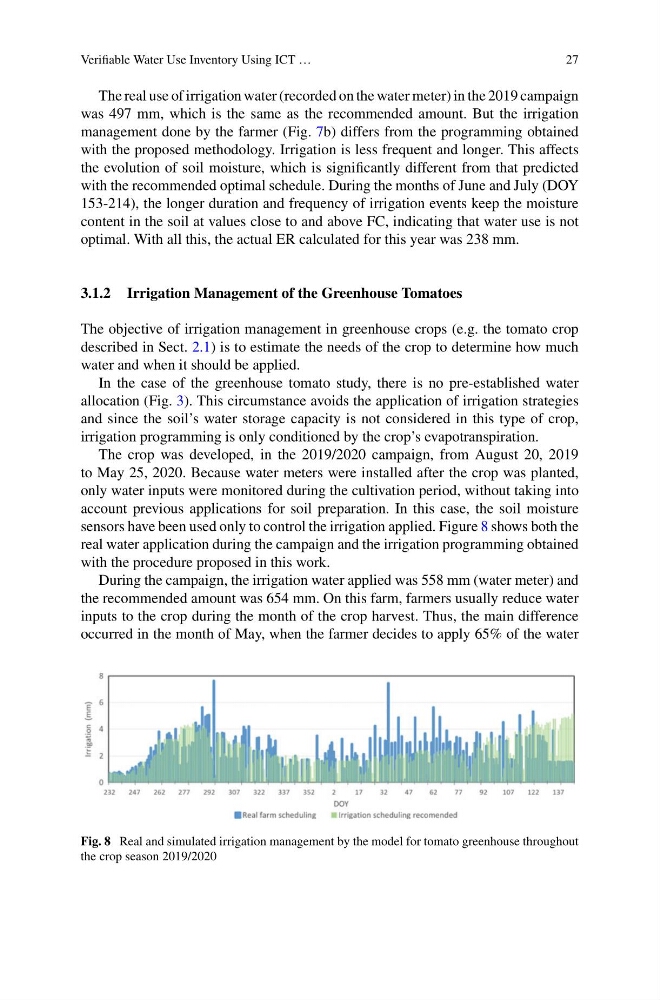
sensors have been used only to control the irrigation applied. Figure 8 shows both the
real water application during the campaign and the irrigation programming obtained
with the procedure proposed in this work.
During the campaign, the irrigation water applied was 558 mm (water meter) and
the recommended amount was 654 mm. On this farm, farmers usually reduce water
inputs to the crop during the month of the crop harvest. Thus, the main difference
occurred in the month of May, when the farmer decides to apply 65% of the water
Fig. 8 Real and simulated irrigation management by the model for tomato greenhouse throughout
the crop season 2019/2020
27
The real use of irrigation water (recorded on the water meter) in the 2019 campaign
was 497 mm, which is the same as the recommended amount. But the irrigation
management done by the farmer (Fig. 7b) differs from the programming obtained
with the proposed methodology. Irrigation is less frequent and longer. This affects
the evolution of soil moisture, which is significantly different from that predicted
with the recommended optimal schedule. During the months of June and July (DOY
153-214), the longer duration and frequency of irrigation events keep the moisture
content in the soil at values close to and above FC, indicating that water use is not
optimal. With all this, the actual ER calculated for this year was 238 mm.
3.1.2 Irrigation Management of the Greenhouse Tomatoes
The objective of irrigation management in greenhouse crops (e.g. the tomato crop
described in Sect. 2.1) is to estimate the needs of the crop to determine how much
water and when it should be applied.
In the case of the greenhouse tomato study, there is no pre-established water
allocation (Fig. 3). This circumstance avoids the application of irrigation strategies
and since the soil’s water storage capacity is not considered in this type of crop,
irrigation programming is only conditioned by the crop’s evapotranspiration.
The crop was developed, in the 2019/2020 campaign, from August 20, 2019
to May 25, 2020. Because water meters were installed after the crop was planted,
only water inputs were monitored during the cultivation period, without taking into
account previous applications for soil preparation. In this case, the soil moisture
sensors have been used only to control the irrigation applied. Figure 8 shows both the
real water application during the campaign and the irrigation programming obtained
with the procedure proposed in this work.
During the campaign, the irrigation water applied was 558 mm (water meter) and
the recommended amount was 654 mm. On this farm, farmers usually reduce water
inputs to the crop during the month of the crop harvest. Thus, the main difference
occurred in the month of May, when the farmer decides to apply 65% of the water
Fig. 8 Real and simulated irrigation management by the model for tomato greenhouse throughout
the crop season 2019/2020