

16
C. M. Flores-Cayuela et al.
2.2.5 Decision to Irrigate
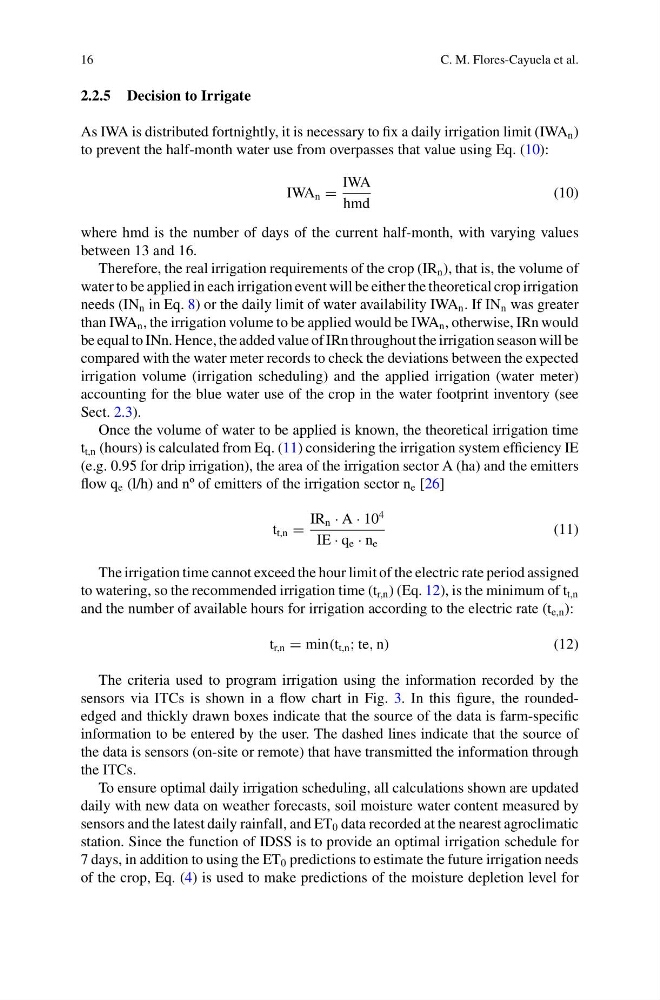
As IWA is distributed fortnightly, it is necessary to fix a daily irrigation limit (IWA n )
to prevent the half-month water use from overpasses that value using Eq. (10):
IWA n =
IWA
hmd
(10)
where hmd is the number of days of the current half-month, with varying values
between 13 and 16.
Therefore, the real irrigation requirements of the crop (IR n ), that is, the volume of
water to be applied in each irrigation event will be either the theoretical crop irrigation
needs (IN n in Eq. 8) or the daily limit of water availability IWA n . If IN n was greater
than IWA n , the irrigation volume to be applied would be IWA n , otherwise, IRn would
be equal to INn. Hence, the added value of IRn throughout the irrigation season will be
compared with the water meter records to check the deviations between the expected
irrigation volume (irrigation scheduling) and the applied irrigation (water meter)
accounting for the blue water use of the crop in the water footprint inventory (see
Sect. 2.3).
Once the volume of water to be applied is known, the theoretical irrigation time
t t,n (hours) is calculated from Eq. (11) considering the irrigation system efficiency IE
(e.g. 0.95 for drip irrigation), the area of the irrigation sector A (ha) and the emitters
flow q e (l/h) and nº of emitters of the irrigation sector n e [26]
t t,n =
IR n · A · 10
4
IE · q e · n e
(11)
The irrigation time cannot exceed the hour limit of the electric rate period assigned
to watering, so the recommended irrigation time (t r,n ) (Eq. 12), is the minimum of t t,n
and the number of available hours for irrigation according to the electric rate (t e,n ):
t r,n = min(t t,n ; te, n)
(12)
The criteria used to program irrigation using the information recorded by the
sensors via ITCs is shown in a flow chart in Fig. 3. In this figure, the roundededged and thickly drawn boxes indicate that the source of the data is farm-specific
information to be entered by the user. The dashed lines indicate that the source of
the data is sensors (on-site or remote) that have transmitted the information through
the ITCs.
To ensure optimal daily irrigation scheduling, all calculations shown are updated
daily with new data on weather forecasts, soil moisture water content measured by
sensors and the latest daily rainfall, and ET 0 data recorded at the nearest agroclimatic
station. Since the function of IDSS is to provide an optimal irrigation schedule for
7 days, in addition to using the ET 0 predictions to estimate the future irrigation needs
of the crop, Eq. (4) is used to make predictions of the moisture depletion level for
C. M. Flores-Cayuela et al.
2.2.5 Decision to Irrigate
As IWA is distributed fortnightly, it is necessary to fix a daily irrigation limit (IWA n )
to prevent the half-month water use from overpasses that value using Eq. (10):
IWA n =
IWA
hmd
(10)
where hmd is the number of days of the current half-month, with varying values
between 13 and 16.
Therefore, the real irrigation requirements of the crop (IR n ), that is, the volume of
water to be applied in each irrigation event will be either the theoretical crop irrigation
needs (IN n in Eq. 8) or the daily limit of water availability IWA n . If IN n was greater
than IWA n , the irrigation volume to be applied would be IWA n , otherwise, IRn would
be equal to INn. Hence, the added value of IRn throughout the irrigation season will be
compared with the water meter records to check the deviations between the expected
irrigation volume (irrigation scheduling) and the applied irrigation (water meter)
accounting for the blue water use of the crop in the water footprint inventory (see
Sect. 2.3).
Once the volume of water to be applied is known, the theoretical irrigation time
t t,n (hours) is calculated from Eq. (11) considering the irrigation system efficiency IE
(e.g. 0.95 for drip irrigation), the area of the irrigation sector A (ha) and the emitters
flow q e (l/h) and nº of emitters of the irrigation sector n e [26]
t t,n =
IR n · A · 10
4
IE · q e · n e
(11)
The irrigation time cannot exceed the hour limit of the electric rate period assigned
to watering, so the recommended irrigation time (t r,n ) (Eq. 12), is the minimum of t t,n
and the number of available hours for irrigation according to the electric rate (t e,n ):
t r,n = min(t t,n ; te, n)
(12)
The criteria used to program irrigation using the information recorded by the
sensors via ITCs is shown in a flow chart in Fig. 3. In this figure, the roundededged and thickly drawn boxes indicate that the source of the data is farm-specific
information to be entered by the user. The dashed lines indicate that the source of
the data is sensors (on-site or remote) that have transmitted the information through
the ITCs.
To ensure optimal daily irrigation scheduling, all calculations shown are updated
daily with new data on weather forecasts, soil moisture water content measured by
sensors and the latest daily rainfall, and ET 0 data recorded at the nearest agroclimatic
station. Since the function of IDSS is to provide an optimal irrigation schedule for
7 days, in addition to using the ET 0 predictions to estimate the future irrigation needs
of the crop, Eq. (4) is used to make predictions of the moisture depletion level for