

164
L. Chai et al.
3.5 Constructing the Input-Output Table
The necessary basis for IO analysis is the IO table, which is a data database that
reflects in detail the relationship between the key elements of the national economic
system. It is also a balance sheet showing the sources of inputs and destinations of
outputs of various sectors (or products) of the economic system. The input column
of the table is its main column, and the column direction indicates the consumption
and use of various input elements, that is, the source of input. The output column
is its object column, and the row direction column indicates where the product is
distributed and used after it is produced, that is, where the output goes. The intermediate input and intermediate output of the main column and the object column are
staggered horizontally and vertically to form the first quadrant of the table, which
is the core part of the IO table. Since the intermediate input items and intermediate
output items are divided into n sectors or products, the first quadrant constitutes a
table like a chessboard.
The main column of the IO table extends from the intermediate input to the
vertical direction; the material form input elements represented by the intermediate
input are extended to a wider range of other forms, such as fixed assets, labor, etc.,
that is, the first quadrant of the table is downward The extension constitutes the
third quadrant; the middle product in the guest column of the table expands to the
right to other uses beyond the production process of the year, such as investment,
consumption, export, etc., that is, the first quadrant of the table expands to the right to
constitute the second quadrant. The entire IO table is centered on the first quadrant,
which summarizes column-oriented input and row-oriented output and is used to
describe the quantitative dependence between various departments or products of
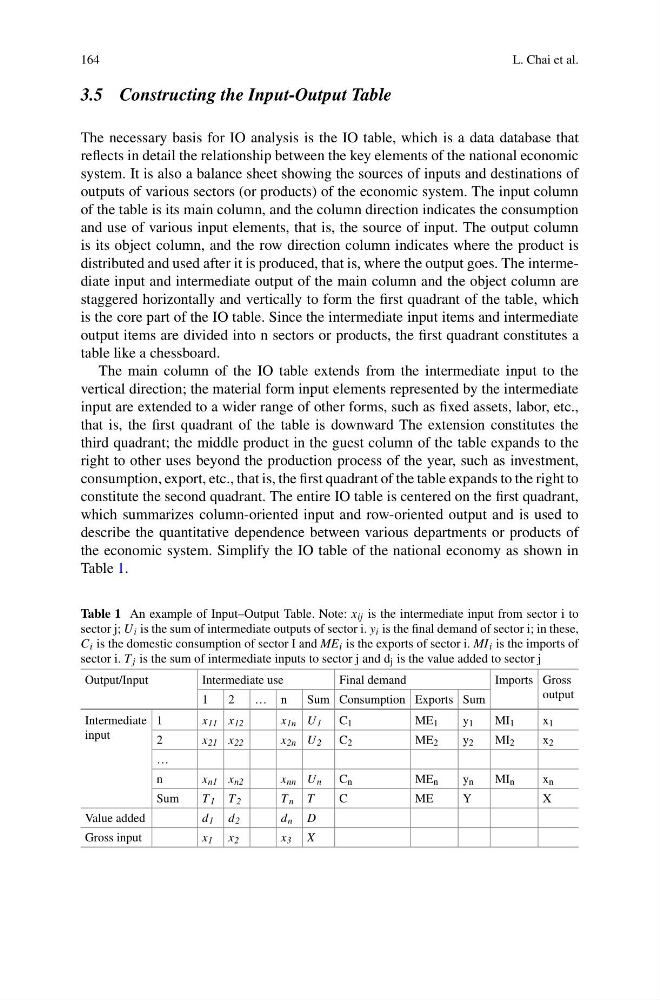
the economic system. Simplify the IO table of the national economy as shown in
Table 1.
Table 1 An example of Input–Output Table. Note: x ij is the intermediate input from sector i to
sector j; U i is the sum of intermediate outputs of sector i. y i is the final demand of sector i; in these,
C i is the domestic consumption of sector I and ME i is the exports of sector i. MI i is the imports of
sector i. T j is the sum of intermediate inputs to sector j and d j is the value added to sector j
Output/Input
Intermediate use
Final demand
Imports Gross
output
1
2
… n
Sum Consumption Exports Sum
Intermediate
input
1
x 11 x 12
x 1n U 1 C 1
ME 1
y 1
MI 1
x 1
2
x 21 x 22
x 2n U 2 C 2
ME 2
y 2
MI 2
x 2
…
n
x n1 x n2
x nn U n C n
ME n
y n
MI n
x n
Sum
T 1 T 2
T n T
C
ME
Y
X
Value added
d 1 d 2
d n D
Gross input
x 1 x 2
x 3 X
L. Chai et al.
3.5 Constructing the Input-Output Table
The necessary basis for IO analysis is the IO table, which is a data database that
reflects in detail the relationship between the key elements of the national economic
system. It is also a balance sheet showing the sources of inputs and destinations of
outputs of various sectors (or products) of the economic system. The input column
of the table is its main column, and the column direction indicates the consumption
and use of various input elements, that is, the source of input. The output column
is its object column, and the row direction column indicates where the product is
distributed and used after it is produced, that is, where the output goes. The intermediate input and intermediate output of the main column and the object column are
staggered horizontally and vertically to form the first quadrant of the table, which
is the core part of the IO table. Since the intermediate input items and intermediate
output items are divided into n sectors or products, the first quadrant constitutes a
table like a chessboard.
The main column of the IO table extends from the intermediate input to the
vertical direction; the material form input elements represented by the intermediate
input are extended to a wider range of other forms, such as fixed assets, labor, etc.,
that is, the first quadrant of the table is downward The extension constitutes the
third quadrant; the middle product in the guest column of the table expands to the
right to other uses beyond the production process of the year, such as investment,
consumption, export, etc., that is, the first quadrant of the table expands to the right to
constitute the second quadrant. The entire IO table is centered on the first quadrant,
which summarizes column-oriented input and row-oriented output and is used to
describe the quantitative dependence between various departments or products of
the economic system. Simplify the IO table of the national economy as shown in
Table 1.
Table 1 An example of Input–Output Table. Note: x ij is the intermediate input from sector i to
sector j; U i is the sum of intermediate outputs of sector i. y i is the final demand of sector i; in these,
C i is the domestic consumption of sector I and ME i is the exports of sector i. MI i is the imports of
sector i. T j is the sum of intermediate inputs to sector j and d j is the value added to sector j
Output/Input
Intermediate use
Final demand
Imports Gross
output
1
2
… n
Sum Consumption Exports Sum
Intermediate
input
1
x 11 x 12
x 1n U 1 C 1
ME 1
y 1
MI 1
x 1
2
x 21 x 22
x 2n U 2 C 2
ME 2
y 2
MI 2
x 2
…
n
x n1 x n2
x nn U n C n
ME n
y n
MI n
x n
Sum
T 1 T 2
T n T
C
ME
Y
X
Value added
d 1 d 2
d n D
Gross input
x 1 x 2
x 3 X