

96
M. D. Alba-Rodríguez et al.
4 Results
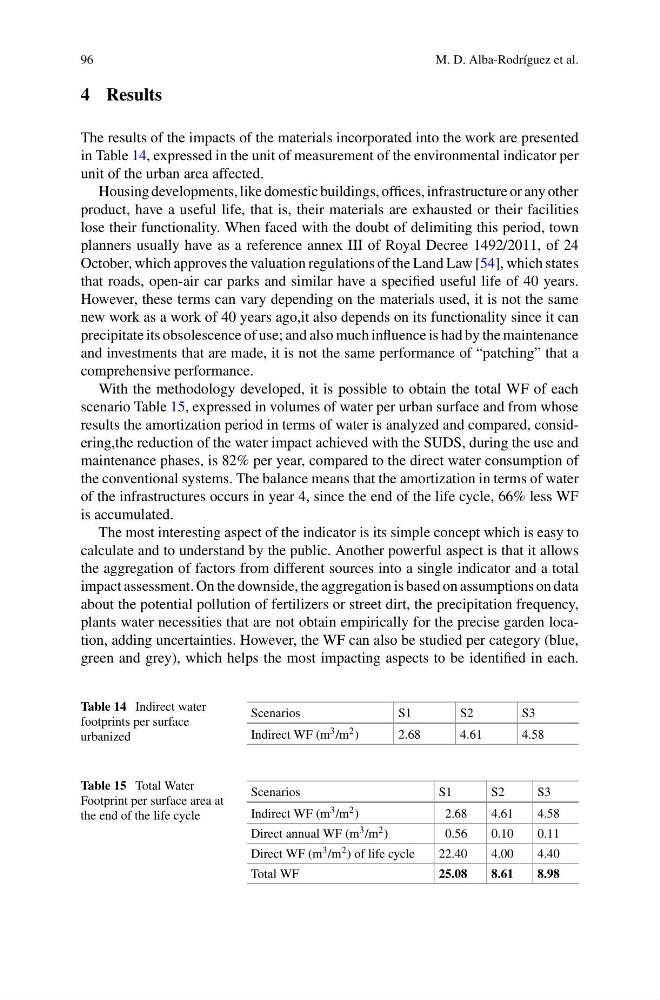
The results of the impacts of the materials incorporated into the work are presented
in Table 14, expressed in the unit of measurement of the environmental indicator per
unit of the urban area affected.
Housing developments, like domestic buildings, offices, infrastructure or any other
product, have a useful life, that is, their materials are exhausted or their facilities
lose their functionality. When faced with the doubt of delimiting this period, town
planners usually have as a reference annex III of Royal Decree 1492/2011, of 24
October, which approves the valuation regulations of the Land Law [54], which states
that roads, open-air car parks and similar have a specified useful life of 40 years.
However, these terms can vary depending on the materials used, it is not the same
new work as a work of 40 years ago,it also depends on its functionality since it can
precipitate its obsolescence of use; and also much influence is had by the maintenance
and investments that are made, it is not the same performance of “patching” that a
comprehensive performance.
With the methodology developed, it is possible to obtain the total WF of each
scenario Table 15, expressed in volumes of water per urban surface and from whose
results the amortization period in terms of water is analyzed and compared, considering,the reduction of the water impact achieved with the SUDS, during the use and
maintenance phases, is 82% per year, compared to the direct water consumption of
the conventional systems. The balance means that the amortization in terms of water
of the infrastructures occurs in year 4, since the end of the life cycle, 66% less WF
is accumulated.
The most interesting aspect of the indicator is its simple concept which is easy to
calculate and to understand by the public. Another powerful aspect is that it allows
the aggregation of factors from different sources into a single indicator and a total
impact assessment. On the downside, the aggregation is based on assumptions on data
about the potential pollution of fertilizers or street dirt, the precipitation frequency,
plants water necessities that are not obtain empirically for the precise garden location, adding uncertainties. However, the WF can also be studied per category (blue,
green and grey), which helps the most impacting aspects to be identified in each.
Table 14 Indirect water
footprints per surface
urbanized
Scenarios
S1
S2
S3
Indirect WF (m 3 /m 2 )
2.68
4.61
4.58
Table 15 Total Water
Footprint per surface area at
the end of the life cycle
Scenarios
S1
S2
S3
Indirect WF (m 3 /m 2 )
2.68
4.61
4.58
Direct annual WF (m 3 /m 2 )
0.56
0.10
0.11
Direct WF (m 3 /m 2 ) of life cycle
22.40
4.00
4.40
Total WF
25.08
8.61
8.98
M. D. Alba-Rodríguez et al.
4 Results
The results of the impacts of the materials incorporated into the work are presented
in Table 14, expressed in the unit of measurement of the environmental indicator per
unit of the urban area affected.
Housing developments, like domestic buildings, offices, infrastructure or any other
product, have a useful life, that is, their materials are exhausted or their facilities
lose their functionality. When faced with the doubt of delimiting this period, town
planners usually have as a reference annex III of Royal Decree 1492/2011, of 24
October, which approves the valuation regulations of the Land Law [54], which states
that roads, open-air car parks and similar have a specified useful life of 40 years.
However, these terms can vary depending on the materials used, it is not the same
new work as a work of 40 years ago,it also depends on its functionality since it can
precipitate its obsolescence of use; and also much influence is had by the maintenance
and investments that are made, it is not the same performance of “patching” that a
comprehensive performance.
With the methodology developed, it is possible to obtain the total WF of each
scenario Table 15, expressed in volumes of water per urban surface and from whose
results the amortization period in terms of water is analyzed and compared, considering,the reduction of the water impact achieved with the SUDS, during the use and
maintenance phases, is 82% per year, compared to the direct water consumption of
the conventional systems. The balance means that the amortization in terms of water
of the infrastructures occurs in year 4, since the end of the life cycle, 66% less WF
is accumulated.
The most interesting aspect of the indicator is its simple concept which is easy to
calculate and to understand by the public. Another powerful aspect is that it allows
the aggregation of factors from different sources into a single indicator and a total
impact assessment. On the downside, the aggregation is based on assumptions on data
about the potential pollution of fertilizers or street dirt, the precipitation frequency,
plants water necessities that are not obtain empirically for the precise garden location, adding uncertainties. However, the WF can also be studied per category (blue,
green and grey), which helps the most impacting aspects to be identified in each.
Table 14 Indirect water
footprints per surface
urbanized
Scenarios
S1
S2
S3
Indirect WF (m 3 /m 2 )
2.68
4.61
4.58
Table 15 Total Water
Footprint per surface area at
the end of the life cycle
Scenarios
S1
S2
S3
Indirect WF (m 3 /m 2 )
2.68
4.61
4.58
Direct annual WF (m 3 /m 2 )
0.56
0.10
0.11
Direct WF (m 3 /m 2 ) of life cycle
22.40
4.00
4.40
Total WF
25.08
8.61
8.98