

5. Development of innovative energy-related technologies for the next generation
(such as space solar power generation, fusion technology)
Based on the characteristics of the CO 2 problem, countermeasure technologies
include “no-regret countermeasures” (such as energy saving, afforestation), “minimum-regret countermeasures” (such as fuel conversion, introduction of new
energy), and “specialized countermeasures” (such as carbon dioxide capture and
storage, CCS). Excluding specialized measures, the technologies contribute to
domestic and local improvements in addition to CO 2 reduction effects, such as
improved economic efficiency, addressing pollution, and increasing energy security,
and are therefore co-beneficial measures. Thus, regardless of whether global climate
change occurs or is caused by CO 2 , the realization of a low-carbon society is
desirable.
3.3.2.4 Difference in Reduction Costs
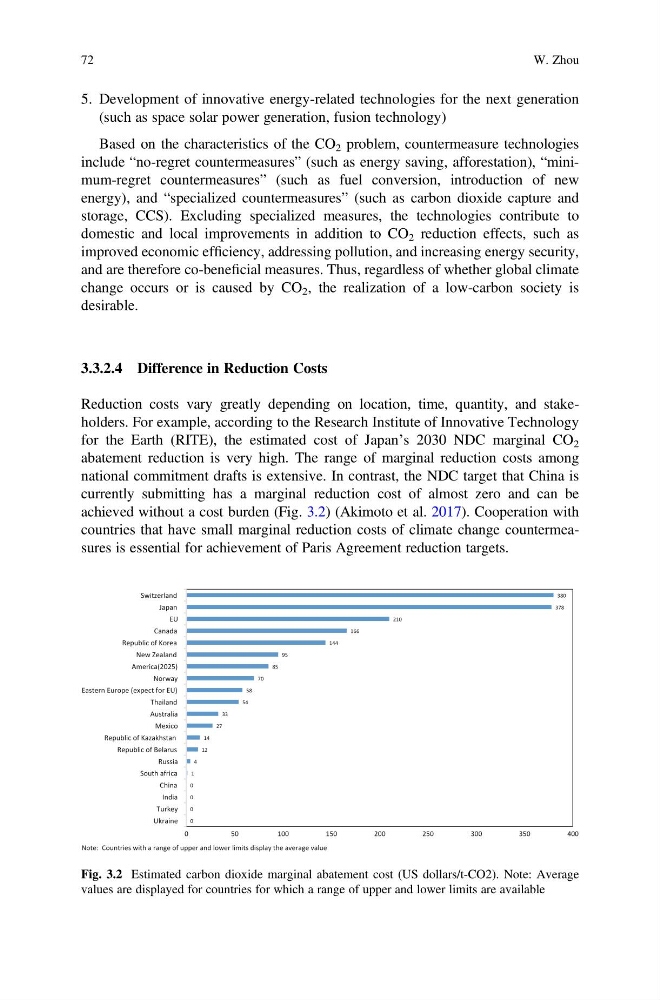
Reduction costs vary greatly depending on location, time, quantity, and stakeholders. For example, according to the Research Institute of Innovative Technology
for the Earth (RITE), the estimated cost of Japan’s 2030 NDC marginal CO 2
abatement reduction is very high. The range of marginal reduction costs among
national commitment drafts is extensive. In contrast, the NDC target that China is
currently submitting has a marginal reduction cost of almost zero and can be
achieved without a cost burden (Fig. 3.2) (Akimoto et al. 2017). Cooperation with
countries that have small marginal reduction costs of climate change countermeasures is essential for achievement of Paris Agreement reduction targets.
380
378
210
166
144
95
85
70
58
54
33
27
14
12
4
1
0
0
0
0
0
Note: Countries with a range of upper and lower limits display the average value
50
100
150
200
250
300
350
400
Switzerland
Japan
EU
Canada
Republic of Korea
New Zealand
America(2025)
Norway
Eastern Europe (expect for EU)
Thailand
Australia
Mexico
Republic of Kazakhstan
Republic of Belarus
Russia
South africa
China
India
Turkey
Ukraine
Fig. 3.2 Estimated carbon dioxide marginal abatement cost (US dollars/t-CO2). Note: Average
values are displayed for countries for which a range of upper and lower limits are available
72
W. Zhou
(such as space solar power generation, fusion technology)
Based on the characteristics of the CO 2 problem, countermeasure technologies
include “no-regret countermeasures” (such as energy saving, afforestation), “minimum-regret countermeasures” (such as fuel conversion, introduction of new
energy), and “specialized countermeasures” (such as carbon dioxide capture and
storage, CCS). Excluding specialized measures, the technologies contribute to
domestic and local improvements in addition to CO 2 reduction effects, such as
improved economic efficiency, addressing pollution, and increasing energy security,
and are therefore co-beneficial measures. Thus, regardless of whether global climate
change occurs or is caused by CO 2 , the realization of a low-carbon society is
desirable.
3.3.2.4 Difference in Reduction Costs
Reduction costs vary greatly depending on location, time, quantity, and stakeholders. For example, according to the Research Institute of Innovative Technology
for the Earth (RITE), the estimated cost of Japan’s 2030 NDC marginal CO 2
abatement reduction is very high. The range of marginal reduction costs among
national commitment drafts is extensive. In contrast, the NDC target that China is
currently submitting has a marginal reduction cost of almost zero and can be
achieved without a cost burden (Fig. 3.2) (Akimoto et al. 2017). Cooperation with
countries that have small marginal reduction costs of climate change countermeasures is essential for achievement of Paris Agreement reduction targets.
380
378
210
166
144
95
85
70
58
54
33
27
14
12
4
1
0
0
0
0
0
Note: Countries with a range of upper and lower limits display the average value
50
100
150
200
250
300
350
400
Switzerland
Japan
EU
Canada
Republic of Korea
New Zealand
America(2025)
Norway
Eastern Europe (expect for EU)
Thailand
Australia
Mexico
Republic of Kazakhstan
Republic of Belarus
Russia
South africa
China
India
Turkey
Ukraine
Fig. 3.2 Estimated carbon dioxide marginal abatement cost (US dollars/t-CO2). Note: Average
values are displayed for countries for which a range of upper and lower limits are available
72
W. Zhou