

renewable energy introduced is low, construction plans for the power grid in North
Rhine-Westphalia are also detailed.
According to the German Federal Network Agency’s 2015 Monitoring Report,
by the third quarter of 2015, 30% of the Transmission Line Expansion Plan was
completed. In order to adapt to the ever-changing state of renewable energy and
power transmission technology, the German transmission line reinforcement plan
will be updated annually to meet the needs of the following 10–20 years.
Construction of a large-scale transmission and distribution system similar to that
in Germany leads to huge costs. In 2014, the four German transmission systems
(TSOs) invested a total of 1769 million EUR. The 808 Power Distribution System
(DSO) invested 6193 million EUR (Federal Network Agency 2015). Japan is also
reinforcing its transmission system by increasing the capacity of the Kitamoto
interconnection line from 600,000 to 900,000 kW, but this is on a much smaller
scale than efforts in Germany. The existing transmission system in Japan requires
maximization of renewable energy introduction, whereas in Germany, in order to
maximize the introduction of renewable energy, a transmission system suitable to
meet a high target is constructed and reinforced. The biggest difference between
Japan and Germany is in the promotion of renewable energy. However, improving
the supply and demand mismatch of renewable energy does not always necessitate
huge costs. One possible solution is to introduce renewable energy mainly in regions
with high power demand, shifting to local production for local consumption.
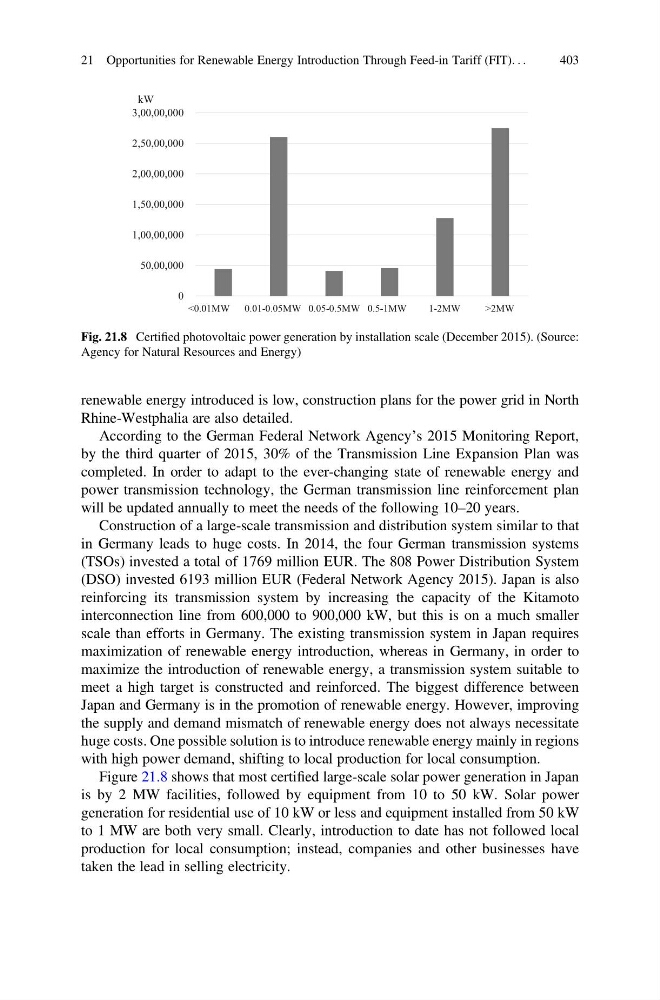
Figure 21.8 shows that most certified large-scale solar power generation in Japan
is by 2 MW facilities, followed by equipment from 10 to 50 kW. Solar power
generation for residential use of 10 kW or less and equipment installed from 50 kW
to 1 MW are both very small. Clearly, introduction to date has not followed local
production for local consumption; instead, companies and other businesses have
taken the lead in selling electricity.
0
50,00,000
1,00,00,000
1,50,00,000
2,00,00,000
2,50,00,000
3,00,00,000
kW
<0.01MW 0.01-0.05MW 0.05-0.5MW 0.5-1MW
1-2MW
>2MW
Fig. 21.8 Certified photovoltaic power generation by installation scale (December 2015). (Source:
Agency for Natural Resources and Energy)
21 Opportunities for Renewable Energy Introduction Through Feed-in Tariff (FIT). . .
403
Rhine-Westphalia are also detailed.
According to the German Federal Network Agency’s 2015 Monitoring Report,
by the third quarter of 2015, 30% of the Transmission Line Expansion Plan was
completed. In order to adapt to the ever-changing state of renewable energy and
power transmission technology, the German transmission line reinforcement plan
will be updated annually to meet the needs of the following 10–20 years.
Construction of a large-scale transmission and distribution system similar to that
in Germany leads to huge costs. In 2014, the four German transmission systems
(TSOs) invested a total of 1769 million EUR. The 808 Power Distribution System
(DSO) invested 6193 million EUR (Federal Network Agency 2015). Japan is also
reinforcing its transmission system by increasing the capacity of the Kitamoto
interconnection line from 600,000 to 900,000 kW, but this is on a much smaller
scale than efforts in Germany. The existing transmission system in Japan requires
maximization of renewable energy introduction, whereas in Germany, in order to
maximize the introduction of renewable energy, a transmission system suitable to
meet a high target is constructed and reinforced. The biggest difference between
Japan and Germany is in the promotion of renewable energy. However, improving
the supply and demand mismatch of renewable energy does not always necessitate
huge costs. One possible solution is to introduce renewable energy mainly in regions
with high power demand, shifting to local production for local consumption.
Figure 21.8 shows that most certified large-scale solar power generation in Japan
is by 2 MW facilities, followed by equipment from 10 to 50 kW. Solar power
generation for residential use of 10 kW or less and equipment installed from 50 kW
to 1 MW are both very small. Clearly, introduction to date has not followed local
production for local consumption; instead, companies and other businesses have
taken the lead in selling electricity.
0
50,00,000
1,00,00,000
1,50,00,000
2,00,00,000
2,50,00,000
3,00,00,000
kW
<0.01MW 0.01-0.05MW 0.05-0.5MW 0.5-1MW
1-2MW
>2MW
Fig. 21.8 Certified photovoltaic power generation by installation scale (December 2015). (Source:
Agency for Natural Resources and Energy)
21 Opportunities for Renewable Energy Introduction Through Feed-in Tariff (FIT). . .
403