

y ¼ À1, 434, 000 þ 138, 800x À 1:032z þ 101, 300 Â log z
ð Þ
ð21:1Þ
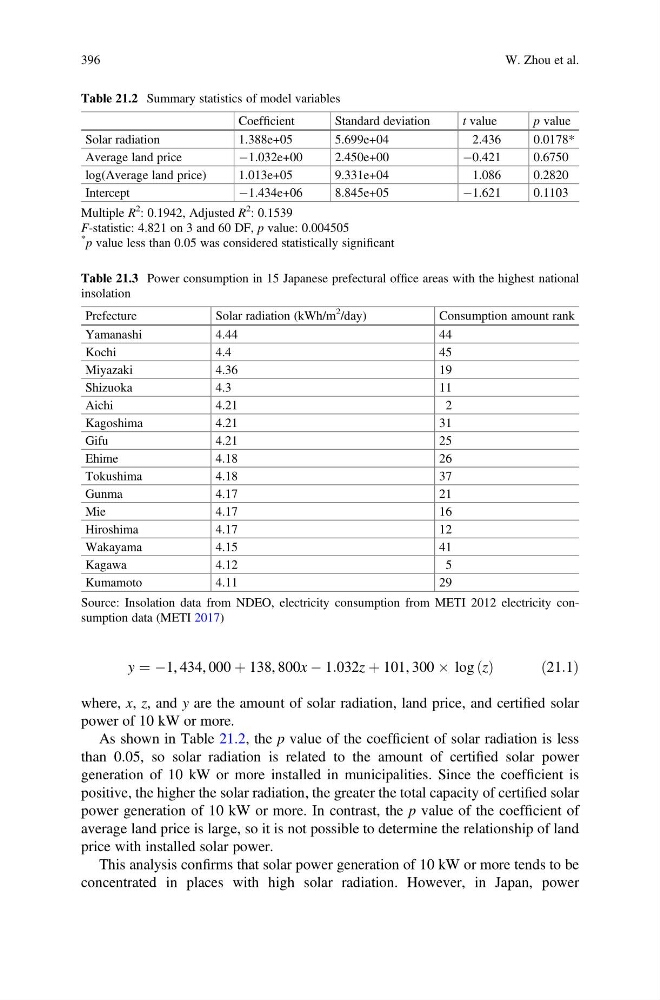
where, x, z, and y are the amount of solar radiation, land price, and certified solar
power of 10 kW or more.
As shown in Table 21.2, the p value of the coefficient of solar radiation is less
than 0.05, so solar radiation is related to the amount of certified solar power
generation of 10 kW or more installed in municipalities. Since the coefficient is
positive, the higher the solar radiation, the greater the total capacity of certified solar
power generation of 10 kW or more. In contrast, the p value of the coefficient of
average land price is large, so it is not possible to determine the relationship of land
price with installed solar power.
This analysis confirms that solar power generation of 10 kW or more tends to be
concentrated in places with high solar radiation. However, in Japan, power
Table 21.2 Summary statistics of model variables
Coefficient
Standard deviation
t value
p value
Solar radiation
1.388e+05
5.699e+04
2.436
0.0178*
Average land price
À1.032e+00
2.450e+00
À0.421
0.6750
log(Average land price)
1.013e+05
9.331e+04
1.086
0.2820
Intercept
À1.434e+06
8.845e+05
À1.621
0.1103
Multiple R
2
: 0.1942, Adjusted R
2
: 0.1539
F-statistic: 4.821 on 3 and 60 DF, p value: 0.004505
*
p value less than 0.05 was considered statistically significant
Table 21.3 Power consumption in 15 Japanese prefectural office areas with the highest national
insolation
Prefecture
Solar radiation (kWh/m
2
/day)
Consumption amount rank
Yamanashi
4.44
44
Kochi
4.4
45
Miyazaki
4.36
19
Shizuoka
4.3
11
Aichi
4.21
2
Kagoshima
4.21
31
Gifu
4.21
25
Ehime
4.18
26
Tokushima
4.18
37
Gunma
4.17
21
Mie
4.17
16
Hiroshima
4.17
12
Wakayama
4.15
41
Kagawa
4.12
5
Kumamoto
4.11
29
Source: Insolation data from NDEO, electricity consumption from METI 2012 electricity consumption data (METI 2017)
396
W. Zhou et al.
ð Þ
ð21:1Þ
where, x, z, and y are the amount of solar radiation, land price, and certified solar
power of 10 kW or more.
As shown in Table 21.2, the p value of the coefficient of solar radiation is less
than 0.05, so solar radiation is related to the amount of certified solar power
generation of 10 kW or more installed in municipalities. Since the coefficient is
positive, the higher the solar radiation, the greater the total capacity of certified solar
power generation of 10 kW or more. In contrast, the p value of the coefficient of
average land price is large, so it is not possible to determine the relationship of land
price with installed solar power.
This analysis confirms that solar power generation of 10 kW or more tends to be
concentrated in places with high solar radiation. However, in Japan, power
Table 21.2 Summary statistics of model variables
Coefficient
Standard deviation
t value
p value
Solar radiation
1.388e+05
5.699e+04
2.436
0.0178*
Average land price
À1.032e+00
2.450e+00
À0.421
0.6750
log(Average land price)
1.013e+05
9.331e+04
1.086
0.2820
Intercept
À1.434e+06
8.845e+05
À1.621
0.1103
Multiple R
2
: 0.1942, Adjusted R
2
: 0.1539
F-statistic: 4.821 on 3 and 60 DF, p value: 0.004505
*
p value less than 0.05 was considered statistically significant
Table 21.3 Power consumption in 15 Japanese prefectural office areas with the highest national
insolation
Prefecture
Solar radiation (kWh/m
2
/day)
Consumption amount rank
Yamanashi
4.44
44
Kochi
4.4
45
Miyazaki
4.36
19
Shizuoka
4.3
11
Aichi
4.21
2
Kagoshima
4.21
31
Gifu
4.21
25
Ehime
4.18
26
Tokushima
4.18
37
Gunma
4.17
21
Mie
4.17
16
Hiroshima
4.17
12
Wakayama
4.15
41
Kagawa
4.12
5
Kumamoto
4.11
29
Source: Insolation data from NDEO, electricity consumption from METI 2012 electricity consumption data (METI 2017)
396
W. Zhou et al.