

7.7 Influence of CO 2 Emission Constraints on System
Combination
In the following analysis, while constraining annual CO 2 emissions to a 10–50%
reduction, system combinations are analyzed with annual total cost as the objective
function to be minimized. For Scenario 1, as the emissions reduction ratio increases,
the share of energy from the utility grid gradually decreases, and natural gas becomes
the dominant energy carrier (Fig. 7.10). In addition, solar heat is introduced with a
constant value, which results in steady total energy supply. The emissions reduction
cost increases from 0.023 USD/kg CO 2 to 0.058 USD/kg CO 2 when CO 2 emissions
are reduced to half their current value.
In Scenario 2, as in Scenario 1, the power share from the utility grid gradually
decreases as the emissions reduction ratio increases (Fig. 7.11). Solar energy is
introduced, and the application pattern gradually changes from solar heat to solar
power. Therefore, the PV system has better environmental performance than the
solar heater. Rural biomass is also widely used in this scenario. Interestingly, total
energy consumption increases sharply as the emissions reduction ratio increases
from 10 to 20% and then decreases gradually. The system has a negative reduction
cost unless CO 2 emissions are reduced to less than 35% of their current value;
economic and environmental benefits can be achieved simultaneously. However,
once total emissions are reduced by half, the reduction cost increases to as much as
0.08 USD/kg CO 2 .
Scenario 3 is the best option in terms of cost-effectiveness in reducing CO 2
emissions because of its negative reduction cost even when annual CO 2 emissions
are halved (Fig. 7.12). Solar power is not adopted in this scenario; as an alternative,
biomass energy in both urban and rural areas is exhausted. Natural gas accounts for a
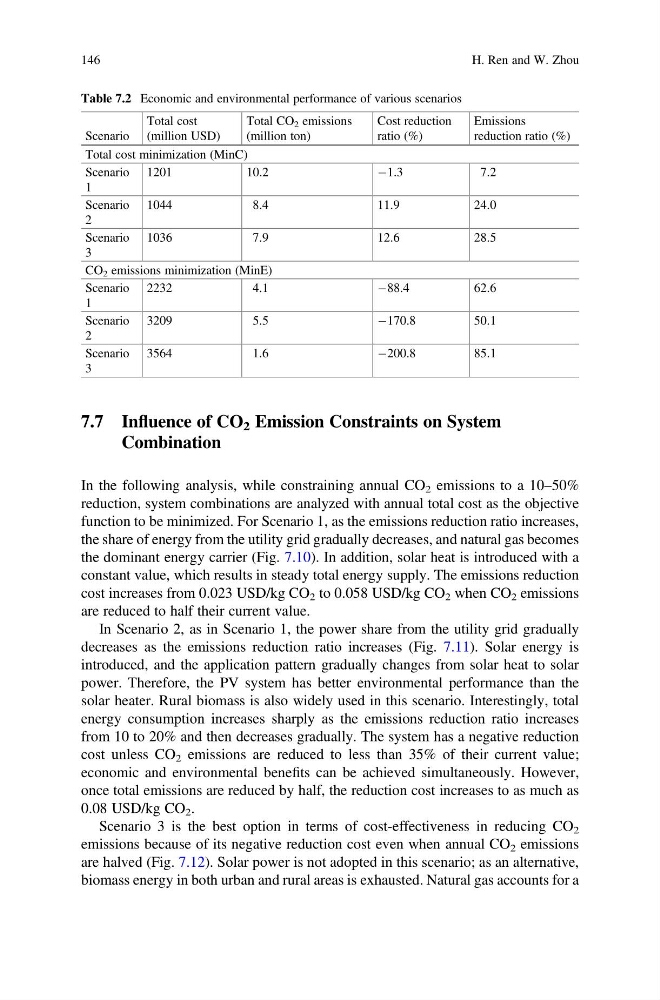
Table 7.2 Economic and environmental performance of various scenarios
Scenario
Total cost
(million USD)
Total CO 2 emissions
(million ton)
Cost reduction
ratio (%)
Emissions
reduction ratio (%)
Total cost minimization (MinC)
Scenario
1
1201
10.2
À1.3
7.2
Scenario
2
1044
8.4
11.9
24.0
Scenario
3
1036
7.9
12.6
28.5
CO 2 emissions minimization (MinE)
Scenario
1
2232
4.1
À88.4
62.6
Scenario
2
3209
5.5
À170.8
50.1
Scenario
3
3564
1.6
À200.8
85.1
146
H. Ren and W. Zhou
Combination
In the following analysis, while constraining annual CO 2 emissions to a 10–50%
reduction, system combinations are analyzed with annual total cost as the objective
function to be minimized. For Scenario 1, as the emissions reduction ratio increases,
the share of energy from the utility grid gradually decreases, and natural gas becomes
the dominant energy carrier (Fig. 7.10). In addition, solar heat is introduced with a
constant value, which results in steady total energy supply. The emissions reduction
cost increases from 0.023 USD/kg CO 2 to 0.058 USD/kg CO 2 when CO 2 emissions
are reduced to half their current value.
In Scenario 2, as in Scenario 1, the power share from the utility grid gradually
decreases as the emissions reduction ratio increases (Fig. 7.11). Solar energy is
introduced, and the application pattern gradually changes from solar heat to solar
power. Therefore, the PV system has better environmental performance than the
solar heater. Rural biomass is also widely used in this scenario. Interestingly, total
energy consumption increases sharply as the emissions reduction ratio increases
from 10 to 20% and then decreases gradually. The system has a negative reduction
cost unless CO 2 emissions are reduced to less than 35% of their current value;
economic and environmental benefits can be achieved simultaneously. However,
once total emissions are reduced by half, the reduction cost increases to as much as
0.08 USD/kg CO 2 .
Scenario 3 is the best option in terms of cost-effectiveness in reducing CO 2
emissions because of its negative reduction cost even when annual CO 2 emissions
are halved (Fig. 7.12). Solar power is not adopted in this scenario; as an alternative,
biomass energy in both urban and rural areas is exhausted. Natural gas accounts for a
Table 7.2 Economic and environmental performance of various scenarios
Scenario
Total cost
(million USD)
Total CO 2 emissions
(million ton)
Cost reduction
ratio (%)
Emissions
reduction ratio (%)
Total cost minimization (MinC)
Scenario
1
1201
10.2
À1.3
7.2
Scenario
2
1044
8.4
11.9
24.0
Scenario
3
1036
7.9
12.6
28.5
CO 2 emissions minimization (MinE)
Scenario
1
2232
4.1
À88.4
62.6
Scenario
2
3209
5.5
À170.8
50.1
Scenario
3
3564
1.6
À200.8
85.1
146
H. Ren and W. Zhou