

10.3 Molecular Crystals as Stage for Novelties
215
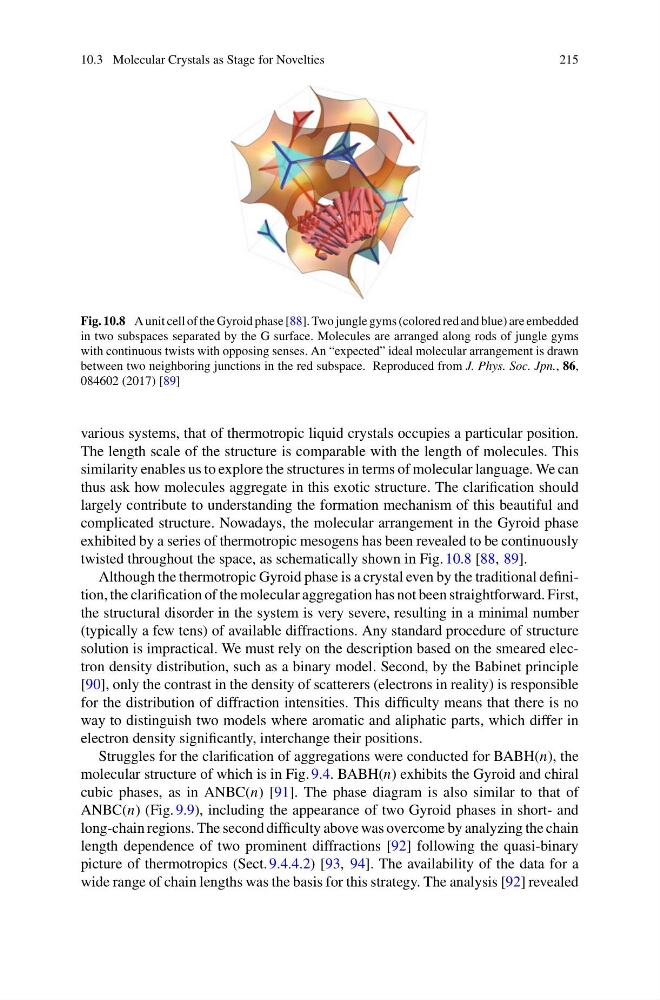
Fig. 10.8 A unit cell of the Gyroid phase [88]. Two jungle gyms (colored red and blue) are embedded
in two subspaces separated by the G surface. Molecules are arranged along rods of jungle gyms
with continuous twists with opposing senses. An “expected” ideal molecular arrangement is drawn
between two neighboring junctions in the red subspace. Reproduced from J. Phys. Soc. Jpn., 86,
084602 (2017) [89]
various systems, that of thermotropic liquid crystals occupies a particular position.
The length scale of the structure is comparable with the length of molecules. This
similarity enables us to explore the structures in terms of molecular language. We can
thus ask how molecules aggregate in this exotic structure. The clarification should
largely contribute to understanding the formation mechanism of this beautiful and
complicated structure. Nowadays, the molecular arrangement in the Gyroid phase
exhibited by a series of thermotropic mesogens has been revealed to be continuously
twisted throughout the space, as schematically shown in Fig. 10.8 [88, 89].
Although the thermotropic Gyroid phase is a crystal even by the traditional definition, the clarification of the molecular aggregation has not been straightforward. First,
the structural disorder in the system is very severe, resulting in a minimal number
(typically a few tens) of available diffractions. Any standard procedure of structure
solution is impractical. We must rely on the description based on the smeared electron density distribution, such as a binary model. Second, by the Babinet principle
[90], only the contrast in the density of scatterers (electrons in reality) is responsible
for the distribution of diffraction intensities. This difficulty means that there is no
way to distinguish two models where aromatic and aliphatic parts, which differ in
electron density significantly, interchange their positions.
Struggles for the clarification of aggregations were conducted for BABH(n), the
molecular structure of which is in Fig. 9.4. BABH(n) exhibits the Gyroid and chiral
cubic phases, as in ANBC(n) [91]. The phase diagram is also similar to that of
ANBC(n) (Fig. 9.9), including the appearance of two Gyroid phases in short- and
long-chain regions. The second difficulty above was overcome by analyzing the chain
length dependence of two prominent diffractions [92] following the quasi-binary
picture of thermotropics (Sect. 9.4.4.2) [93, 94]. The availability of the data for a
wide range of chain lengths was the basis for this strategy. The analysis [92] revealed
215
Fig. 10.8 A unit cell of the Gyroid phase [88]. Two jungle gyms (colored red and blue) are embedded
in two subspaces separated by the G surface. Molecules are arranged along rods of jungle gyms
with continuous twists with opposing senses. An “expected” ideal molecular arrangement is drawn
between two neighboring junctions in the red subspace. Reproduced from J. Phys. Soc. Jpn., 86,
084602 (2017) [89]
various systems, that of thermotropic liquid crystals occupies a particular position.
The length scale of the structure is comparable with the length of molecules. This
similarity enables us to explore the structures in terms of molecular language. We can
thus ask how molecules aggregate in this exotic structure. The clarification should
largely contribute to understanding the formation mechanism of this beautiful and
complicated structure. Nowadays, the molecular arrangement in the Gyroid phase
exhibited by a series of thermotropic mesogens has been revealed to be continuously
twisted throughout the space, as schematically shown in Fig. 10.8 [88, 89].
Although the thermotropic Gyroid phase is a crystal even by the traditional definition, the clarification of the molecular aggregation has not been straightforward. First,
the structural disorder in the system is very severe, resulting in a minimal number
(typically a few tens) of available diffractions. Any standard procedure of structure
solution is impractical. We must rely on the description based on the smeared electron density distribution, such as a binary model. Second, by the Babinet principle
[90], only the contrast in the density of scatterers (electrons in reality) is responsible
for the distribution of diffraction intensities. This difficulty means that there is no
way to distinguish two models where aromatic and aliphatic parts, which differ in
electron density significantly, interchange their positions.
Struggles for the clarification of aggregations were conducted for BABH(n), the
molecular structure of which is in Fig. 9.4. BABH(n) exhibits the Gyroid and chiral
cubic phases, as in ANBC(n) [91]. The phase diagram is also similar to that of
ANBC(n) (Fig. 9.9), including the appearance of two Gyroid phases in short- and
long-chain regions. The second difficulty above was overcome by analyzing the chain
length dependence of two prominent diffractions [92] following the quasi-binary
picture of thermotropics (Sect. 9.4.4.2) [93, 94]. The availability of the data for a
wide range of chain lengths was the basis for this strategy. The analysis [92] revealed