

10.1 Motional Correlation
203
Fig. 10.2 An example of the first excited state of the Ising model with ferromagnetic interaction
on a chain. The dotted vertical line indicates the location of a “wall” between ordered domains with
opposing magnetizations
6
8
10
3
2
4
6
8
10
4
2
4
6
8
10
5
2
f
/ Hz
30
20
10
0
T
-1 / kK
-1
z = 3 2
1
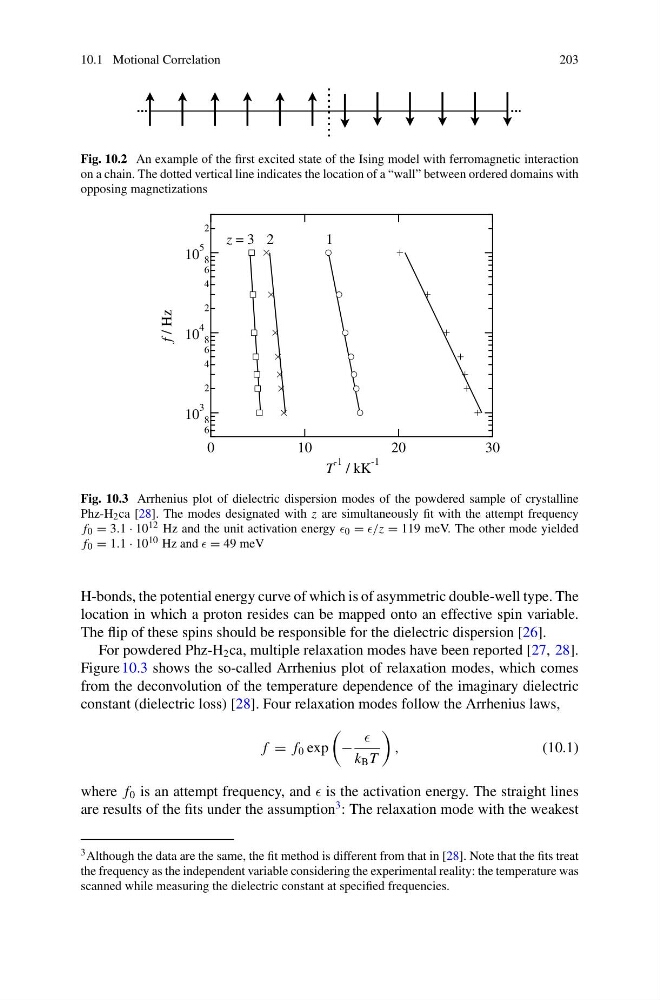
Fig. 10.3 Arrhenius plot of dielectric dispersion modes of the powdered sample of crystalline
Phz-H 2 ca [28]. The modes designated with z are simultaneously fit with the attempt frequency
f 0 = 3.1 · 10 12 Hz and the unit activation energy 0 = = 119 meV. The other mode yielded
f 0 = 1.1 · 10 10 Hz and = 49 meV
H-bonds, the potential energy curve of which is of asymmetric double-well type. The
location in which a proton resides can be mapped onto an effective spin variable.
The flip of these spins should be responsible for the dielectric dispersion [26].
For powdered Phz-H 2 ca, multiple relaxation modes have been reported [27, 28].
Figure 10.3 shows the so-called Arrhenius plot of relaxation modes, which comes
from the deconvolution of the temperature dependence of the imaginary dielectric
constant (dielectric loss) [28]. Four relaxation modes follow the Arrhenius laws,
f = f 0 exp
−
k B T
,
(10.1)
where f 0 is an attempt frequency, and is the activation energy. The straight lines
are results of the fits under the assumption
3 : The relaxation mode with the weakest
3 Although the data are the same, the fit method is different from that in [28]. Note that the fits treat
the frequency as the independent variable considering the experimental reality: the temperature was
scanned while measuring the dielectric constant at specified frequencies.
203
Fig. 10.2 An example of the first excited state of the Ising model with ferromagnetic interaction
on a chain. The dotted vertical line indicates the location of a “wall” between ordered domains with
opposing magnetizations
6
8
10
3
2
4
6
8
10
4
2
4
6
8
10
5
2
f
/ Hz
30
20
10
0
T
-1 / kK
-1
z = 3 2
1
Fig. 10.3 Arrhenius plot of dielectric dispersion modes of the powdered sample of crystalline
Phz-H 2 ca [28]. The modes designated with z are simultaneously fit with the attempt frequency
f 0 = 3.1 · 10 12 Hz and the unit activation energy 0 = = 119 meV. The other mode yielded
f 0 = 1.1 · 10 10 Hz and = 49 meV
H-bonds, the potential energy curve of which is of asymmetric double-well type. The
location in which a proton resides can be mapped onto an effective spin variable.
The flip of these spins should be responsible for the dielectric dispersion [26].
For powdered Phz-H 2 ca, multiple relaxation modes have been reported [27, 28].
Figure 10.3 shows the so-called Arrhenius plot of relaxation modes, which comes
from the deconvolution of the temperature dependence of the imaginary dielectric
constant (dielectric loss) [28]. Four relaxation modes follow the Arrhenius laws,
f = f 0 exp
−
k B T
,
(10.1)
where f 0 is an attempt frequency, and is the activation energy. The straight lines
are results of the fits under the assumption
3 : The relaxation mode with the weakest
3 Although the data are the same, the fit method is different from that in [28]. Note that the fits treat
the frequency as the independent variable considering the experimental reality: the temperature was
scanned while measuring the dielectric constant at specified frequencies.