

8.1 Glass as Frozen-in State
167
-2
0
2
(dT/dt) / (mK min
-1
)
300
250
200
T / K
Tg
liquid-quenched glass
supercooled
liquid
crystallization
TCHM
H
T
liquid
rapid cooling
slow cooling
Tg
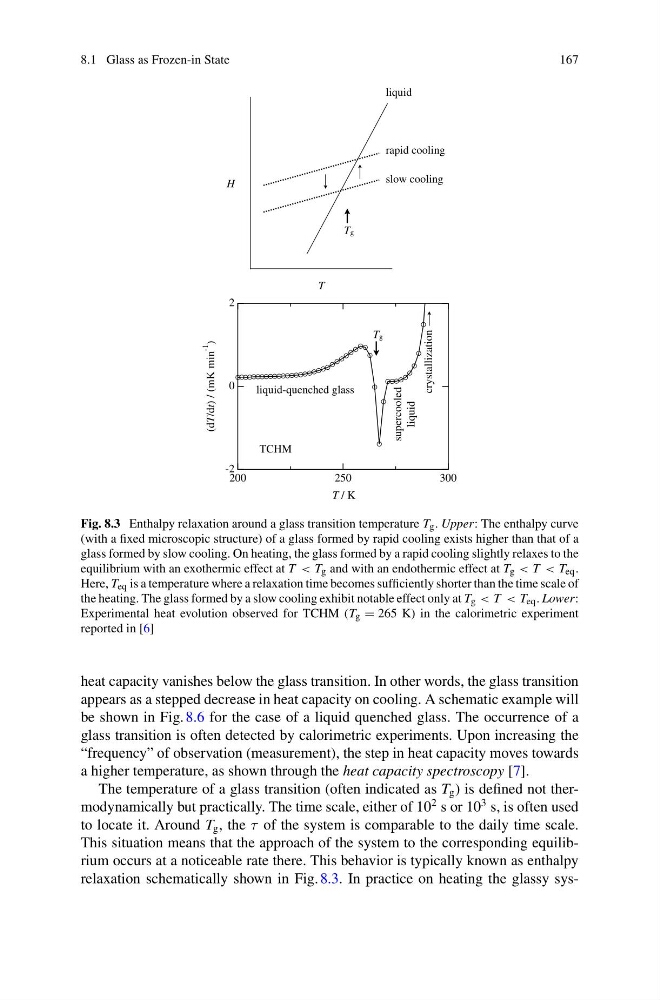
Fig. 8.3 Enthalpy relaxation around a glass transition temperature T g . Upper: The enthalpy curve
(with a fixed microscopic structure) of a glass formed by rapid cooling exists higher than that of a
glass formed by slow cooling. On heating, the glass formed by a rapid cooling slightly relaxes to the
equilibrium with an exothermic effect at T < T g and with an endothermic effect at T g < T < T eq .
Here, T eq is a temperature where a relaxation time becomes sufficiently shorter than the time scale of
the heating. The glass formed by a slow cooling exhibit notable effect only at T g < T < T eq . Lower:
Experimental heat evolution observed for TCHM (T g = 265 K) in the calorimetric experiment
reported in [6]
heat capacity vanishes below the glass transition. In other words, the glass transition
appears as a stepped decrease in heat capacity on cooling. A schematic example will
be shown in Fig. 8.6 for the case of a liquid quenched glass. The occurrence of a
glass transition is often detected by calorimetric experiments. Upon increasing the
“frequency” of observation (measurement), the step in heat capacity moves towards
a higher temperature, as shown through the heat capacity spectroscopy [7].
The temperature of a glass transition (often indicated as T g ) is defined not thermodynamically but practically. The time scale, either of 10
2 s or 10
3 s, is often used
to locate it. Around T g , the τ of the system is comparable to the daily time scale.
This situation means that the approach of the system to the corresponding equilibrium occurs at a noticeable rate there. This behavior is typically known as enthalpy
relaxation schematically shown in Fig. 8.3. In practice on heating the glassy sys-
167
-2
0
2
(dT/dt) / (mK min
-1
)
300
250
200
T / K
Tg
liquid-quenched glass
supercooled
liquid
crystallization
TCHM
H
T
liquid
rapid cooling
slow cooling
Tg
Fig. 8.3 Enthalpy relaxation around a glass transition temperature T g . Upper: The enthalpy curve
(with a fixed microscopic structure) of a glass formed by rapid cooling exists higher than that of a
glass formed by slow cooling. On heating, the glass formed by a rapid cooling slightly relaxes to the
equilibrium with an exothermic effect at T < T g and with an endothermic effect at T g < T < T eq .
Here, T eq is a temperature where a relaxation time becomes sufficiently shorter than the time scale of
the heating. The glass formed by a slow cooling exhibit notable effect only at T g < T < T eq . Lower:
Experimental heat evolution observed for TCHM (T g = 265 K) in the calorimetric experiment
reported in [6]
heat capacity vanishes below the glass transition. In other words, the glass transition
appears as a stepped decrease in heat capacity on cooling. A schematic example will
be shown in Fig. 8.6 for the case of a liquid quenched glass. The occurrence of a
glass transition is often detected by calorimetric experiments. Upon increasing the
“frequency” of observation (measurement), the step in heat capacity moves towards
a higher temperature, as shown through the heat capacity spectroscopy [7].
The temperature of a glass transition (often indicated as T g ) is defined not thermodynamically but practically. The time scale, either of 10
2 s or 10
3 s, is often used
to locate it. Around T g , the τ of the system is comparable to the daily time scale.
This situation means that the approach of the system to the corresponding equilibrium occurs at a noticeable rate there. This behavior is typically known as enthalpy
relaxation schematically shown in Fig. 8.3. In practice on heating the glassy sys-