

each of the ten trend sites. Nitrate deposition during 1998 remained virtually the
same as the historical average (1979–1998). In the years since 1998, the we have
seen a trend toward less sulfate in precipitation in New England. Until about 2000,
trends in nitrate remained fairly constant, but since 2000, even the nitrate deposition
in New England has begun to decrease.
The year-to-year variation that is recorded at the NADP sites can be attributed to
differences in precipitation and prevailing wind patterns, as well as emission
sources. This is characteristic of precipitation data and should be viewed as normal.
Trends in pollutant deposition within New England, whether due to long-term
changes in pollutants emitted to the atmosphere or trends in climate, will be evident
only after many years (10–20+ years).
Lakes and streams have been slower to respond, but we have begun to see
improvement. A report in Nature Magazine in 1998 showed some improvement in
400,000
300,000
Emissions, tons
200,000
100,000
0
Year
1990
1995
2,000
2,005
2,010
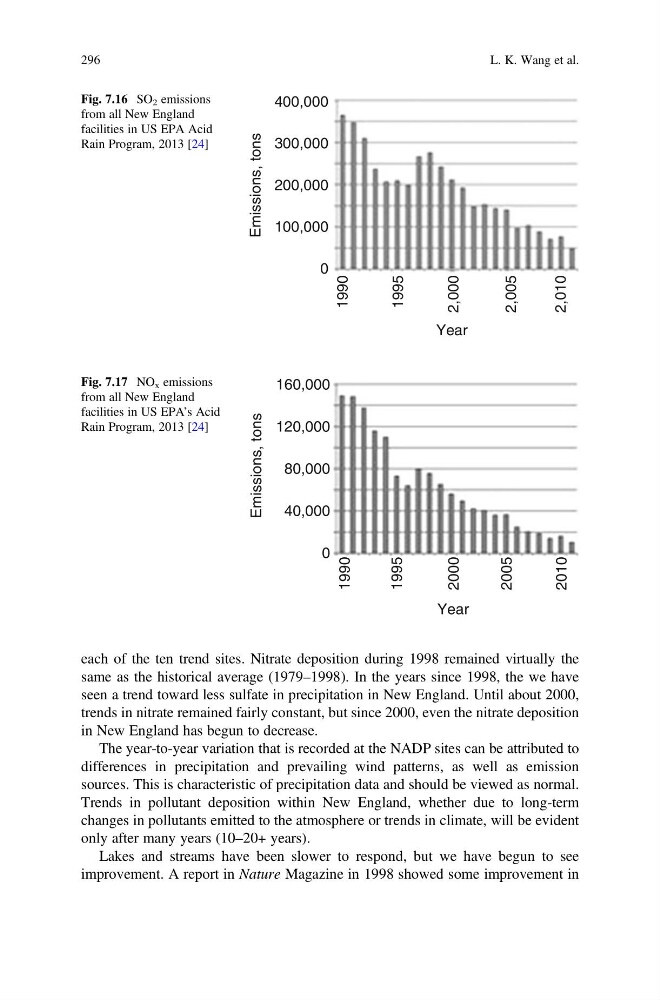
Fig. 7.16 SO 2 emissions
from all New England
facilities in US EPA Acid
Rain Program, 2013 [24]
160,000
120,000
Emissions, tons
80,000
40,000
0
Year
1990
1995
2000
2005
2010
Fig. 7.17 NO x emissions
from all New England
facilities in US EPA’s Acid
Rain Program, 2013 [24]
296
L. K. Wang et al.
same as the historical average (1979–1998). In the years since 1998, the we have
seen a trend toward less sulfate in precipitation in New England. Until about 2000,
trends in nitrate remained fairly constant, but since 2000, even the nitrate deposition
in New England has begun to decrease.
The year-to-year variation that is recorded at the NADP sites can be attributed to
differences in precipitation and prevailing wind patterns, as well as emission
sources. This is characteristic of precipitation data and should be viewed as normal.
Trends in pollutant deposition within New England, whether due to long-term
changes in pollutants emitted to the atmosphere or trends in climate, will be evident
only after many years (10–20+ years).
Lakes and streams have been slower to respond, but we have begun to see
improvement. A report in Nature Magazine in 1998 showed some improvement in
400,000
300,000
Emissions, tons
200,000
100,000
0
Year
1990
1995
2,000
2,005
2,010
Fig. 7.16 SO 2 emissions
from all New England
facilities in US EPA Acid
Rain Program, 2013 [24]
160,000
120,000
Emissions, tons
80,000
40,000
0
Year
1990
1995
2000
2005
2010
Fig. 7.17 NO x emissions
from all New England
facilities in US EPA’s Acid
Rain Program, 2013 [24]
296
L. K. Wang et al.