

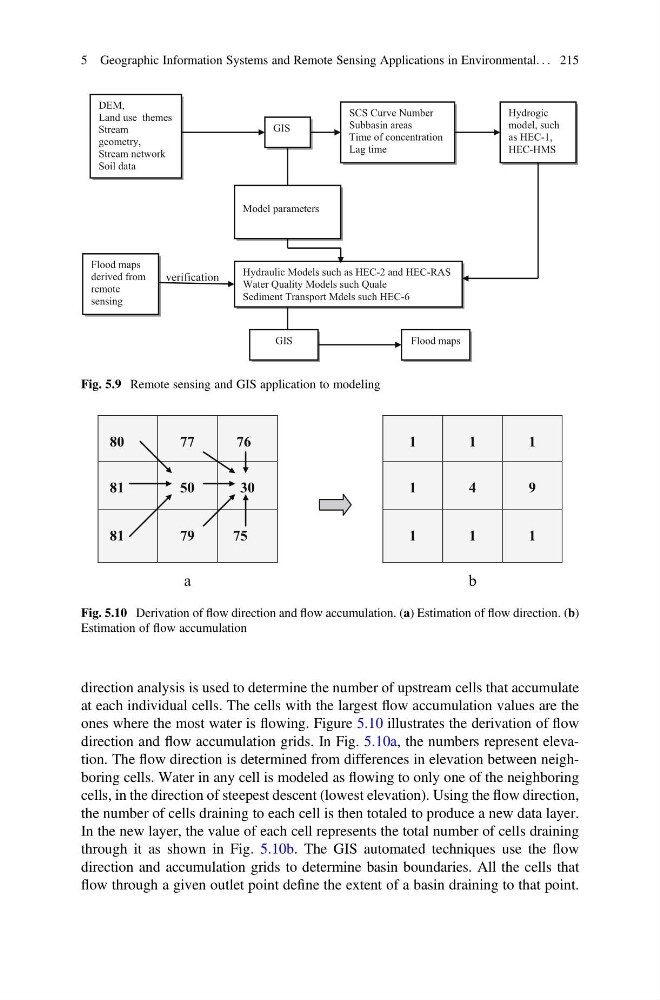
direction analysis is used to determine the number of upstream cells that accumulate
at each individual cells. The cells with the largest flow accumulation values are the
ones where the most water is flowing. Figure 5.10 illustrates the derivation of flow
direction and flow accumulation grids. In Fig. 5.10a, the numbers represent elevation. The flow direction is determined from differences in elevation between neighboring cells. Water in any cell is modeled as flowing to only one of the neighboring
cells, in the direction of steepest descent (lowest elevation). Using the flow direction,
the number of cells draining to each cell is then totaled to produce a new data layer.
In the new layer, the value of each cell represents the total number of cells draining
through it as shown in Fig. 5.10b. The GIS automated techniques use the flow
direction and accumulation grids to determine basin boundaries. All the cells that
flow through a given outlet point define the extent of a basin draining to that point.
verification
DEM,
Land use themes
Stream
geometry,
Stream network
Soil data
GIS
SCS Curve Number
Subbasin areas
Time of concentration
Lag time
Hydrogic
model, such
as HEC-1,
HEC-HMS
Model parameters
Hydraulic Models such as HEC-2 and HEC-RAS
Water Quality Models such Quale
Sediment Transport Mdels such HEC-6
GIS
Flood maps
derived from
remote
sensing
Flood maps
Fig. 5.9 Remote sensing and GIS application to modeling
a
b
80
77
76
81
50
30
81
79
75
1
1
1
1
4
9
1
1
1
Fig. 5.10 Derivation of flow direction and flow accumulation. (a) Estimation of flow direction. (b)
Estimation of flow accumulation
5 Geographic Information Systems and Remote Sensing Applications in Environmental. . . 215
at each individual cells. The cells with the largest flow accumulation values are the
ones where the most water is flowing. Figure 5.10 illustrates the derivation of flow
direction and flow accumulation grids. In Fig. 5.10a, the numbers represent elevation. The flow direction is determined from differences in elevation between neighboring cells. Water in any cell is modeled as flowing to only one of the neighboring
cells, in the direction of steepest descent (lowest elevation). Using the flow direction,
the number of cells draining to each cell is then totaled to produce a new data layer.
In the new layer, the value of each cell represents the total number of cells draining
through it as shown in Fig. 5.10b. The GIS automated techniques use the flow
direction and accumulation grids to determine basin boundaries. All the cells that
flow through a given outlet point define the extent of a basin draining to that point.
verification
DEM,
Land use themes
Stream
geometry,
Stream network
Soil data
GIS
SCS Curve Number
Subbasin areas
Time of concentration
Lag time
Hydrogic
model, such
as HEC-1,
HEC-HMS
Model parameters
Hydraulic Models such as HEC-2 and HEC-RAS
Water Quality Models such Quale
Sediment Transport Mdels such HEC-6
GIS
Flood maps
derived from
remote
sensing
Flood maps
Fig. 5.9 Remote sensing and GIS application to modeling
a
b
80
77
76
81
50
30
81
79
75
1
1
1
1
4
9
1
1
1
Fig. 5.10 Derivation of flow direction and flow accumulation. (a) Estimation of flow direction. (b)
Estimation of flow accumulation
5 Geographic Information Systems and Remote Sensing Applications in Environmental. . . 215