

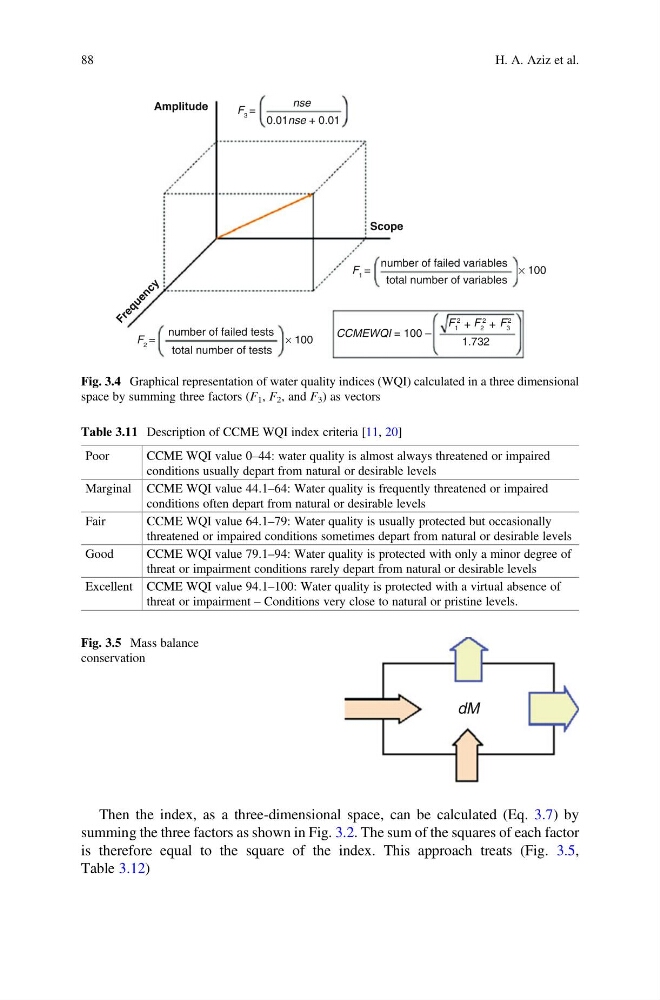
Then the index, as a three-dimensional space, can be calculated (Eq. 3.7) by
summing the three factors as shown in Fig. 3.2. The sum of the squares of each factor
is therefore equal to the square of the index. This approach treats (Fig. 3.5,
Table 3.12)
Amplitude
F r e q u e n c y
Scope
F 1 =
+
+
F 1
2
F 2
2
F 3
2
number of failed variables
nse
0.01nse + 0.01
total number of variables
CCMEWQI = 100 –
1.732
× 100
F 2 =
F 3 =
number of failed tests
total number of tests
× 100
Fig. 3.4 Graphical representation of water quality indices (WQI) calculated in a three dimensional
space by summing three factors (F 1 , F 2 , and F 3 ) as vectors
Table 3.11 Description of CCME WQI index criteria [11, 20]
Poor
CCME WQI value 0–44: water quality is almost always threatened or impaired
conditions usually depart from natural or desirable levels
Marginal CCME WQI value 44.1–64: Water quality is frequently threatened or impaired
conditions often depart from natural or desirable levels
Fair
CCME WQI value 64.1–79: Water quality is usually protected but occasionally
threatened or impaired conditions sometimes depart from natural or desirable levels
Good
CCME WQI value 79.1–94: Water quality is protected with only a minor degree of
threat or impairment conditions rarely depart from natural or desirable levels
Excellent CCME WQI value 94.1–100: Water quality is protected with a virtual absence of
threat or impairment – Conditions very close to natural or pristine levels.
dM
Fig. 3.5 Mass balance
conservation
88
H. A. Aziz et al.
summing the three factors as shown in Fig. 3.2. The sum of the squares of each factor
is therefore equal to the square of the index. This approach treats (Fig. 3.5,
Table 3.12)
Amplitude
F r e q u e n c y
Scope
F 1 =
+
+
F 1
2
F 2
2
F 3
2
number of failed variables
nse
0.01nse + 0.01
total number of variables
CCMEWQI = 100 –
1.732
× 100
F 2 =
F 3 =
number of failed tests
total number of tests
× 100
Fig. 3.4 Graphical representation of water quality indices (WQI) calculated in a three dimensional
space by summing three factors (F 1 , F 2 , and F 3 ) as vectors
Table 3.11 Description of CCME WQI index criteria [11, 20]
Poor
CCME WQI value 0–44: water quality is almost always threatened or impaired
conditions usually depart from natural or desirable levels
Marginal CCME WQI value 44.1–64: Water quality is frequently threatened or impaired
conditions often depart from natural or desirable levels
Fair
CCME WQI value 64.1–79: Water quality is usually protected but occasionally
threatened or impaired conditions sometimes depart from natural or desirable levels
Good
CCME WQI value 79.1–94: Water quality is protected with only a minor degree of
threat or impairment conditions rarely depart from natural or desirable levels
Excellent CCME WQI value 94.1–100: Water quality is protected with a virtual absence of
threat or impairment – Conditions very close to natural or pristine levels.
dM
Fig. 3.5 Mass balance
conservation
88
H. A. Aziz et al.