

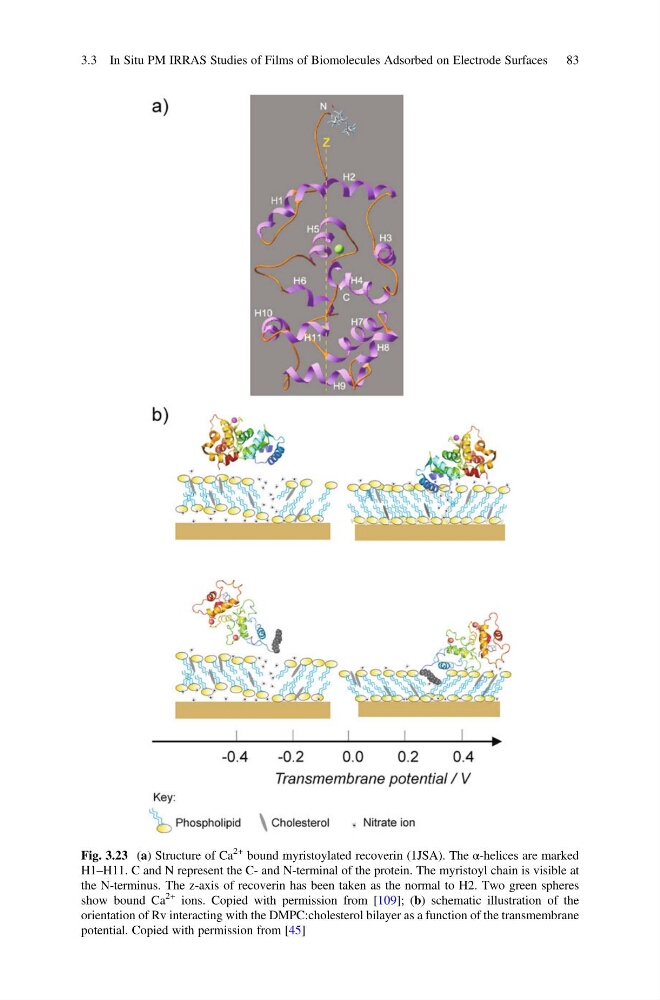
Fig. 3.23 (a) Structure of Ca
2+ bound myristoylated recoverin (1JSA). The α-helices are marked
H1–H11. C and N represent the C- and N-terminal of the protein. The myristoyl chain is visible at
the N-terminus. The z-axis of recoverin has been taken as the normal to H2. Two green spheres
show bound Ca
2+ ions. Copied with permission from [109]; (b) schematic illustration of the
orientation of Rv interacting with the DMPC:cholesterol bilayer as a function of the transmembrane
potential. Copied with permission from [45]
3.3 In Situ PM IRRAS Studies of Films of Biomolecules Adsorbed on Electrode Surfaces 83
2+ bound myristoylated recoverin (1JSA). The α-helices are marked
H1–H11. C and N represent the C- and N-terminal of the protein. The myristoyl chain is visible at
the N-terminus. The z-axis of recoverin has been taken as the normal to H2. Two green spheres
show bound Ca
2+ ions. Copied with permission from [109]; (b) schematic illustration of the
orientation of Rv interacting with the DMPC:cholesterol bilayer as a function of the transmembrane
potential. Copied with permission from [45]
3.3 In Situ PM IRRAS Studies of Films of Biomolecules Adsorbed on Electrode Surfaces 83