

358
S. Kalita and H. Talukdar
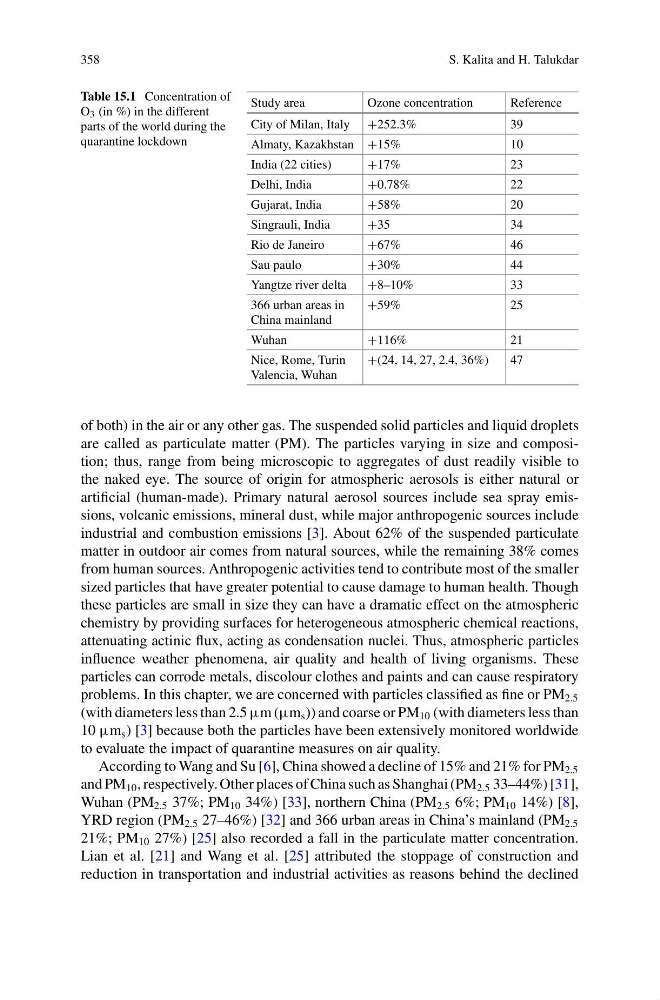
Table 15.1 Concentration of
O 3 (in %) in the different
parts of the world during the
quarantine lockdown
Study area
Ozone concentration
Reference
City of Milan, Italy +252.3%
39
Almaty, Kazakhstan +15%
10
India (22 cities)
+17%
23
Delhi, India
+0.78%
22
Gujarat, India
+58%
20
Singrauli, India
+35
34
Rio de Janeiro
+67%
46
Sau paulo
+30%
44
Yangtze river delta
+8–10%
33
366 urban areas in
China mainland
+59%
25
Wuhan
+116%
21
Nice, Rome, Turin
Valencia, Wuhan
+(24, 14, 27, 2.4, 36%)
47
of both) in the air or any other gas. The suspended solid particles and liquid droplets
are called as particulate matter (PM). The particles varying in size and composition; thus, range from being microscopic to aggregates of dust readily visible to
the naked eye. The source of origin for atmospheric aerosols is either natural or
artificial (human-made). Primary natural aerosol sources include sea spray emissions, volcanic emissions, mineral dust, while major anthropogenic sources include
industrial and combustion emissions [3]. About 62% of the suspended particulate
matter in outdoor air comes from natural sources, while the remaining 38% comes
from human sources. Anthropogenic activities tend to contribute most of the smaller
sized particles that have greater potential to cause damage to human health. Though
these particles are small in size they can have a dramatic effect on the atmospheric
chemistry by providing surfaces for heterogeneous atmospheric chemical reactions,
attenuating actinic flux, acting as condensation nuclei. Thus, atmospheric particles
influence weather phenomena, air quality and health of living organisms. These
particles can corrode metals, discolour clothes and paints and can cause respiratory
problems. In this chapter, we are concerned with particles classified as fine or PM 2.5
(with diameters less than 2.5 µm (µm s )) and coarse or PM 10 (with diameters less than
10 µm s ) [3] because both the particles have been extensively monitored worldwide
to evaluate the impact of quarantine measures on air quality.
According to Wang and Su [6], China showed a decline of 15% and 21% for PM 2.5
and PM 10 , respectively. Other places of China such as Shanghai (PM 2.5 33–44%) [31],
Wuhan (PM 2.5 37%; PM 10 34%) [33], northern China (PM 2.5 6%; PM 10 14%) [8],
YRD region (PM 2.5 27–46%) [32] and 366 urban areas in China’s mainland (PM 2.5
21%; PM 10 27%) [25] also recorded a fall in the particulate matter concentration.
Lian et al. [21] and Wang et al. [25] attributed the stoppage of construction and
reduction in transportation and industrial activities as reasons behind the declined
S. Kalita and H. Talukdar
Table 15.1 Concentration of
O 3 (in %) in the different
parts of the world during the
quarantine lockdown
Study area
Ozone concentration
Reference
City of Milan, Italy +252.3%
39
Almaty, Kazakhstan +15%
10
India (22 cities)
+17%
23
Delhi, India
+0.78%
22
Gujarat, India
+58%
20
Singrauli, India
+35
34
Rio de Janeiro
+67%
46
Sau paulo
+30%
44
Yangtze river delta
+8–10%
33
366 urban areas in
China mainland
+59%
25
Wuhan
+116%
21
Nice, Rome, Turin
Valencia, Wuhan
+(24, 14, 27, 2.4, 36%)
47
of both) in the air or any other gas. The suspended solid particles and liquid droplets
are called as particulate matter (PM). The particles varying in size and composition; thus, range from being microscopic to aggregates of dust readily visible to
the naked eye. The source of origin for atmospheric aerosols is either natural or
artificial (human-made). Primary natural aerosol sources include sea spray emissions, volcanic emissions, mineral dust, while major anthropogenic sources include
industrial and combustion emissions [3]. About 62% of the suspended particulate
matter in outdoor air comes from natural sources, while the remaining 38% comes
from human sources. Anthropogenic activities tend to contribute most of the smaller
sized particles that have greater potential to cause damage to human health. Though
these particles are small in size they can have a dramatic effect on the atmospheric
chemistry by providing surfaces for heterogeneous atmospheric chemical reactions,
attenuating actinic flux, acting as condensation nuclei. Thus, atmospheric particles
influence weather phenomena, air quality and health of living organisms. These
particles can corrode metals, discolour clothes and paints and can cause respiratory
problems. In this chapter, we are concerned with particles classified as fine or PM 2.5
(with diameters less than 2.5 µm (µm s )) and coarse or PM 10 (with diameters less than
10 µm s ) [3] because both the particles have been extensively monitored worldwide
to evaluate the impact of quarantine measures on air quality.
According to Wang and Su [6], China showed a decline of 15% and 21% for PM 2.5
and PM 10 , respectively. Other places of China such as Shanghai (PM 2.5 33–44%) [31],
Wuhan (PM 2.5 37%; PM 10 34%) [33], northern China (PM 2.5 6%; PM 10 14%) [8],
YRD region (PM 2.5 27–46%) [32] and 366 urban areas in China’s mainland (PM 2.5
21%; PM 10 27%) [25] also recorded a fall in the particulate matter concentration.
Lian et al. [21] and Wang et al. [25] attributed the stoppage of construction and
reduction in transportation and industrial activities as reasons behind the declined