

1 COVID-19: An Opportunity for Smart and Sustainable …
9
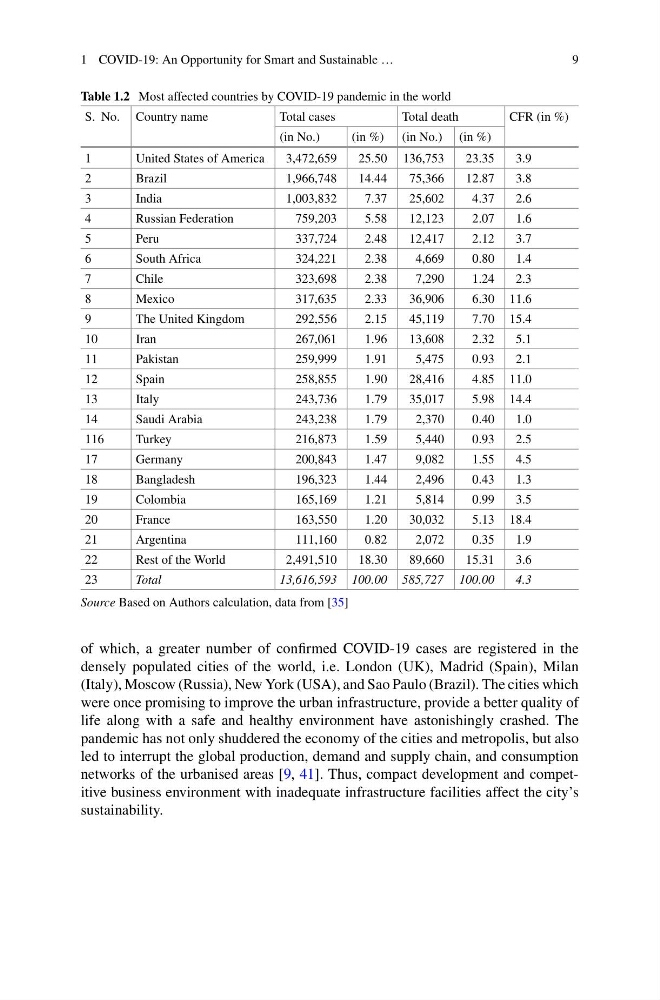
Table 1.2 Most affected countries by COVID-19 pandemic in the world
S. No. Country name
Total cases
Total death
CFR (in %)
(in No.)
(in %) (in No.) (in %)
1
United States of America
3,472,659
25.50 136,753
23.35
3.9
2
Brazil
1,966,748
14.44
75,366
12.87
3.8
3
India
1,003,832
7.37
25,602
4.37
2.6
4
Russian Federation
759,203
5.58
12,123
2.07
1.6
5
Peru
337,724
2.48
12,417
2.12
3.7
6
South Africa
324,221
2.38
4,669
0.80
1.4
7
Chile
323,698
2.38
7,290
1.24
2.3
8
Mexico
317,635
2.33
36,906
6.30 11.6
9
The United Kingdom
292,556
2.15
45,119
7.70 15.4
10
Iran
267,061
1.96
13,608
2.32
5.1
11
Pakistan
259,999
1.91
5,475
0.93
2.1
12
Spain
258,855
1.90
28,416
4.85 11.0
13
Italy
243,736
1.79
35,017
5.98 14.4
14
Saudi Arabia
243,238
1.79
2,370
0.40
1.0
116
Turkey
216,873
1.59
5,440
0.93
2.5
17
Germany
200,843
1.47
9,082
1.55
4.5
18
Bangladesh
196,323
1.44
2,496
0.43
1.3
19
Colombia
165,169
1.21
5,814
0.99
3.5
20
France
163,550
1.20
30,032
5.13 18.4
21
Argentina
111,160
0.82
2,072
0.35
1.9
22
Rest of the World
2,491,510
18.30
89,660
15.31
3.6
23
Total
13,616,593 100.00 585,727 100.00
4.3
Source Based on Authors calculation, data from [35]
of which, a greater number of confirmed COVID-19 cases are registered in the
densely populated cities of the world, i.e. London (UK), Madrid (Spain), Milan
(Italy), Moscow (Russia), New York (USA), and Sao Paulo (Brazil). The cities which
were once promising to improve the urban infrastructure, provide a better quality of
life along with a safe and healthy environment have astonishingly crashed. The
pandemic has not only shuddered the economy of the cities and metropolis, but also
led to interrupt the global production, demand and supply chain, and consumption
networks of the urbanised areas [9, 41]. Thus, compact development and competitive business environment with inadequate infrastructure facilities affect the city’s
sustainability.
9
Table 1.2 Most affected countries by COVID-19 pandemic in the world
S. No. Country name
Total cases
Total death
CFR (in %)
(in No.)
(in %) (in No.) (in %)
1
United States of America
3,472,659
25.50 136,753
23.35
3.9
2
Brazil
1,966,748
14.44
75,366
12.87
3.8
3
India
1,003,832
7.37
25,602
4.37
2.6
4
Russian Federation
759,203
5.58
12,123
2.07
1.6
5
Peru
337,724
2.48
12,417
2.12
3.7
6
South Africa
324,221
2.38
4,669
0.80
1.4
7
Chile
323,698
2.38
7,290
1.24
2.3
8
Mexico
317,635
2.33
36,906
6.30 11.6
9
The United Kingdom
292,556
2.15
45,119
7.70 15.4
10
Iran
267,061
1.96
13,608
2.32
5.1
11
Pakistan
259,999
1.91
5,475
0.93
2.1
12
Spain
258,855
1.90
28,416
4.85 11.0
13
Italy
243,736
1.79
35,017
5.98 14.4
14
Saudi Arabia
243,238
1.79
2,370
0.40
1.0
116
Turkey
216,873
1.59
5,440
0.93
2.5
17
Germany
200,843
1.47
9,082
1.55
4.5
18
Bangladesh
196,323
1.44
2,496
0.43
1.3
19
Colombia
165,169
1.21
5,814
0.99
3.5
20
France
163,550
1.20
30,032
5.13 18.4
21
Argentina
111,160
0.82
2,072
0.35
1.9
22
Rest of the World
2,491,510
18.30
89,660
15.31
3.6
23
Total
13,616,593 100.00 585,727 100.00
4.3
Source Based on Authors calculation, data from [35]
of which, a greater number of confirmed COVID-19 cases are registered in the
densely populated cities of the world, i.e. London (UK), Madrid (Spain), Milan
(Italy), Moscow (Russia), New York (USA), and Sao Paulo (Brazil). The cities which
were once promising to improve the urban infrastructure, provide a better quality of
life along with a safe and healthy environment have astonishingly crashed. The
pandemic has not only shuddered the economy of the cities and metropolis, but also
led to interrupt the global production, demand and supply chain, and consumption
networks of the urbanised areas [9, 41]. Thus, compact development and competitive business environment with inadequate infrastructure facilities affect the city’s
sustainability.