

6
M. Fatewar and Vaishali
Table 1.1 Region-wise existing scenario of the COVID-19 pandemic
S. No. Region name
Region code Confirmed cases
Confirmed death CFR (in %)
(in No.)
(in %) (in No.) (in %)
1
American
Region
AMRO
7,154,840 52.55 297,855 50.85 4.16
2
Europe Region EURO
3,008,972 22.10 205,482 35.08 6.83
3
Eastern
Mediterranean
Region
EMRO
1,346,982
9.89
33,281
5.68 2.47
4
South-East
Asia Region
SEARO
1,308,441
9.61
32,100
5.48 2.45
5
African
Region
AFRO
543,122
3.99
9,130
1.56 1.68
6
Western
Pacific Region
WPRO
253,495
1.86
7,866
1.34 3.10
7
Other
Other
741
0.01
13
0.00 1.75
8
Total
13,616,593 100.00 585,727 100.00 4.30
Source Based on Authors calculation, data from [35]
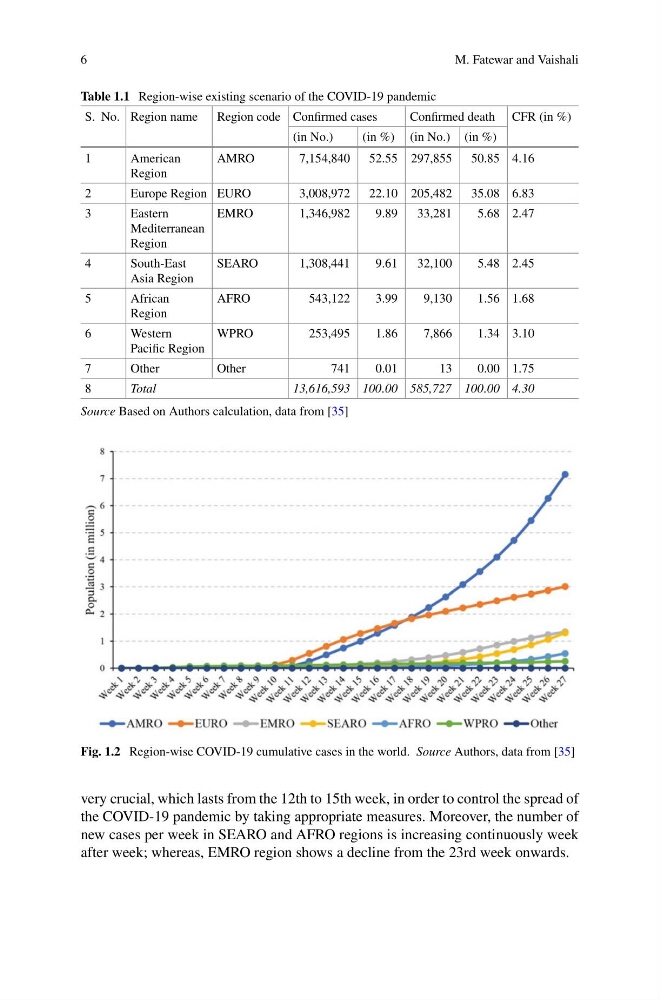
Fig. 1.2 Region-wise COVID-19 cumulative cases in the world. Source Authors, data from [35]
very crucial, which lasts from the 12th to 15th week, in order to control the spread of
the COVID-19 pandemic by taking appropriate measures. Moreover, the number of
new cases per week in SEARO and AFRO regions is increasing continuously week
after week; whereas, EMRO region shows a decline from the 23rd week onwards.
M. Fatewar and Vaishali
Table 1.1 Region-wise existing scenario of the COVID-19 pandemic
S. No. Region name
Region code Confirmed cases
Confirmed death CFR (in %)
(in No.)
(in %) (in No.) (in %)
1
American
Region
AMRO
7,154,840 52.55 297,855 50.85 4.16
2
Europe Region EURO
3,008,972 22.10 205,482 35.08 6.83
3
Eastern
Mediterranean
Region
EMRO
1,346,982
9.89
33,281
5.68 2.47
4
South-East
Asia Region
SEARO
1,308,441
9.61
32,100
5.48 2.45
5
African
Region
AFRO
543,122
3.99
9,130
1.56 1.68
6
Western
Pacific Region
WPRO
253,495
1.86
7,866
1.34 3.10
7
Other
Other
741
0.01
13
0.00 1.75
8
Total
13,616,593 100.00 585,727 100.00 4.30
Source Based on Authors calculation, data from [35]
Fig. 1.2 Region-wise COVID-19 cumulative cases in the world. Source Authors, data from [35]
very crucial, which lasts from the 12th to 15th week, in order to control the spread of
the COVID-19 pandemic by taking appropriate measures. Moreover, the number of
new cases per week in SEARO and AFRO regions is increasing continuously week
after week; whereas, EMRO region shows a decline from the 23rd week onwards.