

5 The Dual Impact of Lockdown on Curbing COVID-19 Spread …
135
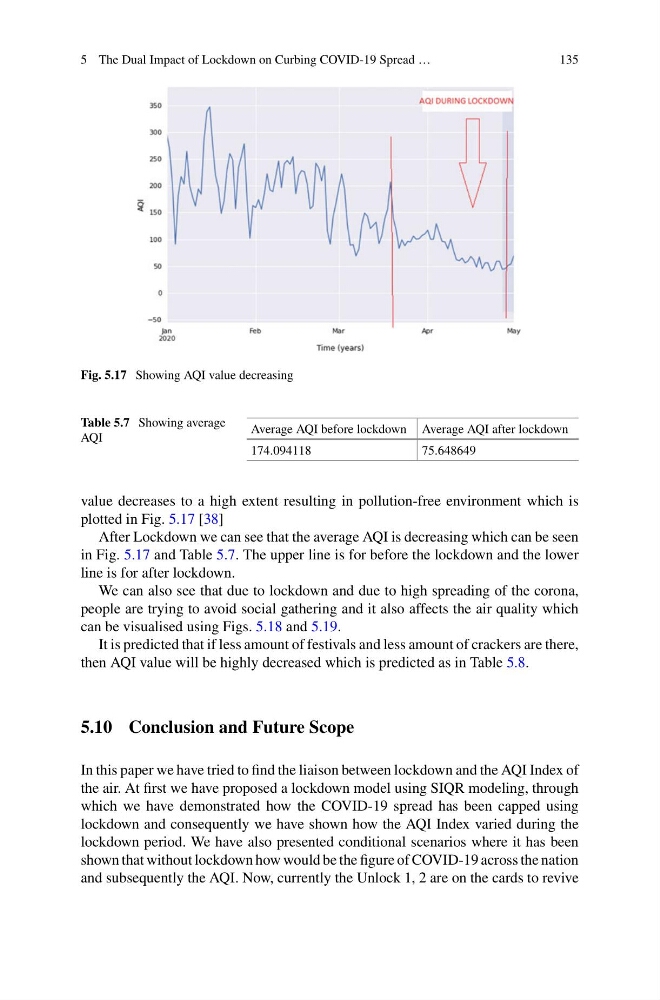
Fig. 5.17 Showing AQI value decreasing
Table 5.7 Showing average
AQI
Average AQI before lockdown Average AQI after lockdown
174.094118
75.648649
value decreases to a high extent resulting in pollution-free environment which is
plotted in Fig. 5.17 [38]
After Lockdown we can see that the average AQI is decreasing which can be seen
in Fig. 5.17 and Table 5.7. The upper line is for before the lockdown and the lower
line is for after lockdown.
We can also see that due to lockdown and due to high spreading of the corona,
people are trying to avoid social gathering and it also affects the air quality which
can be visualised using Figs. 5.18 and 5.19.
It is predicted that if less amount of festivals and less amount of crackers are there,
then AQI value will be highly decreased which is predicted as in Table 5.8.
5.10 Conclusion and Future Scope
In this paper we have tried to find the liaison between lockdown and the AQI Index of
the air. At first we have proposed a lockdown model using SIQR modeling, through
which we have demonstrated how the COVID-19 spread has been capped using
lockdown and consequently we have shown how the AQI Index varied during the
lockdown period. We have also presented conditional scenarios where it has been
shown that without lockdown how would be the figure of COVID-19 across the nation
and subsequently the AQI. Now, currently the Unlock 1, 2 are on the cards to revive
135
Fig. 5.17 Showing AQI value decreasing
Table 5.7 Showing average
AQI
Average AQI before lockdown Average AQI after lockdown
174.094118
75.648649
value decreases to a high extent resulting in pollution-free environment which is
plotted in Fig. 5.17 [38]
After Lockdown we can see that the average AQI is decreasing which can be seen
in Fig. 5.17 and Table 5.7. The upper line is for before the lockdown and the lower
line is for after lockdown.
We can also see that due to lockdown and due to high spreading of the corona,
people are trying to avoid social gathering and it also affects the air quality which
can be visualised using Figs. 5.18 and 5.19.
It is predicted that if less amount of festivals and less amount of crackers are there,
then AQI value will be highly decreased which is predicted as in Table 5.8.
5.10 Conclusion and Future Scope
In this paper we have tried to find the liaison between lockdown and the AQI Index of
the air. At first we have proposed a lockdown model using SIQR modeling, through
which we have demonstrated how the COVID-19 spread has been capped using
lockdown and consequently we have shown how the AQI Index varied during the
lockdown period. We have also presented conditional scenarios where it has been
shown that without lockdown how would be the figure of COVID-19 across the nation
and subsequently the AQI. Now, currently the Unlock 1, 2 are on the cards to revive