

15. Always recap standard levels and the C13:0ME solution as
soon as is feasible to prevent evaporation, which would affect
the concentration. Keep the C13:0ME solution used for a
particular analysis until it has passed QA/QC.
16. Correct for internal standard recovery – in this case, C13:0ME
(the software will do this for you if you have entered an ISTD).
Only work up data when calibration quality of correlation is
0.999 or better. Always check software integration and retention times to ensure they are correct. Response factors can be
significantly different between different fatty acids; use only
respective response factors for quantification and for novel
fatty acids that are not present in the calibration mix. Determine respective response factors by transferring existing
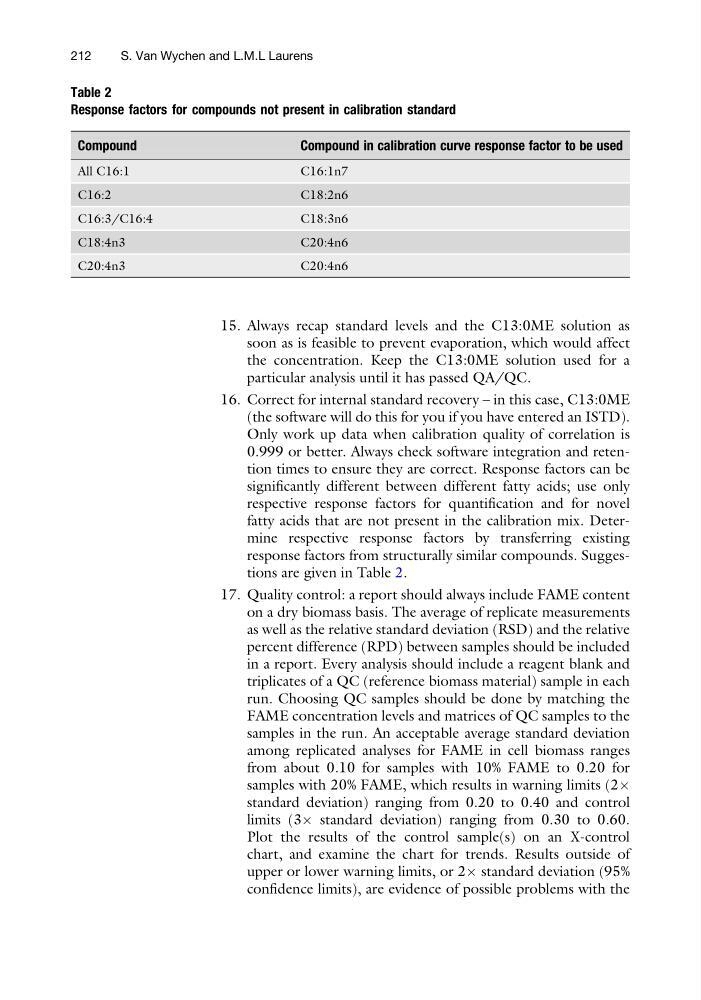
response factors from structurally similar compounds. Suggestions are given in Table 2.
17. Quality control: a report should always include FAME content
on a dry biomass basis. The average of replicate measurements
as well as the relative standard deviation (RSD) and the relative
percent difference (RPD) between samples should be included
in a report. Every analysis should include a reagent blank and
triplicates of a QC (reference biomass material) sample in each
run. Choosing QC samples should be done by matching the
FAME concentration levels and matrices of QC samples to the
samples in the run. An acceptable average standard deviation
among replicated analyses for FAME in cell biomass ranges
from about 0.10 for samples with 10% FAME to 0.20 for
samples with 20% FAME, which results in warning limits (2Â
standard deviation) ranging from 0.20 to 0.40 and control
limits (3Â standard deviation) ranging from 0.30 to 0.60.
Plot the results of the control sample(s) on an X-control
chart, and examine the chart for trends. Results outside of
upper or lower warning limits, or 2Â standard deviation (95%
confidence limits), are evidence of possible problems with the
Table 2
Response factors for compounds not present in calibration standard
Compound
Compound in calibration curve response factor to be used
All C16:1
C16:1n7
C16:2
C18:2n6
C16:3/C16:4
C18:3n6
C18:4n3
C20:4n6
C20:4n3
C20:4n6
212
S. Van Wychen and L.M.L Laurens
soon as is feasible to prevent evaporation, which would affect
the concentration. Keep the C13:0ME solution used for a
particular analysis until it has passed QA/QC.
16. Correct for internal standard recovery – in this case, C13:0ME
(the software will do this for you if you have entered an ISTD).
Only work up data when calibration quality of correlation is
0.999 or better. Always check software integration and retention times to ensure they are correct. Response factors can be
significantly different between different fatty acids; use only
respective response factors for quantification and for novel
fatty acids that are not present in the calibration mix. Determine respective response factors by transferring existing
response factors from structurally similar compounds. Suggestions are given in Table 2.
17. Quality control: a report should always include FAME content
on a dry biomass basis. The average of replicate measurements
as well as the relative standard deviation (RSD) and the relative
percent difference (RPD) between samples should be included
in a report. Every analysis should include a reagent blank and
triplicates of a QC (reference biomass material) sample in each
run. Choosing QC samples should be done by matching the
FAME concentration levels and matrices of QC samples to the
samples in the run. An acceptable average standard deviation
among replicated analyses for FAME in cell biomass ranges
from about 0.10 for samples with 10% FAME to 0.20 for
samples with 20% FAME, which results in warning limits (2Â
standard deviation) ranging from 0.20 to 0.40 and control
limits (3Â standard deviation) ranging from 0.30 to 0.60.
Plot the results of the control sample(s) on an X-control
chart, and examine the chart for trends. Results outside of
upper or lower warning limits, or 2Â standard deviation (95%
confidence limits), are evidence of possible problems with the
Table 2
Response factors for compounds not present in calibration standard
Compound
Compound in calibration curve response factor to be used
All C16:1
C16:1n7
C16:2
C18:2n6
C16:3/C16:4
C18:3n6
C18:4n3
C20:4n6
C20:4n3
C20:4n6
212
S. Van Wychen and L.M.L Laurens