

82
4 Testing and Validating Against Historic Spills
a)
b)
0
500
1 000
1 500
2 000
2 500
3 000
3 500
0 1 2 3 4 5 6 7 8 9 10 11 12 13 14 15 16 17 18 19 20
Impact (km)
Simulation number
Threshold high
Limit high
Impact
Limit Low
Threshold low
Overall mean: 1 137 km
0
500
1 000
1 500
2 000
2 500
3 000
3 500
4 000
4 500
0 1 2 3 4 5 6 7 8 9 10 11 12 13 14 15 16 17 18 19 20
Impact (km)
Simulation number
Threshold high
Limit high
Impact
Limit Low
Threshold low
Overall mean: 2 225 km
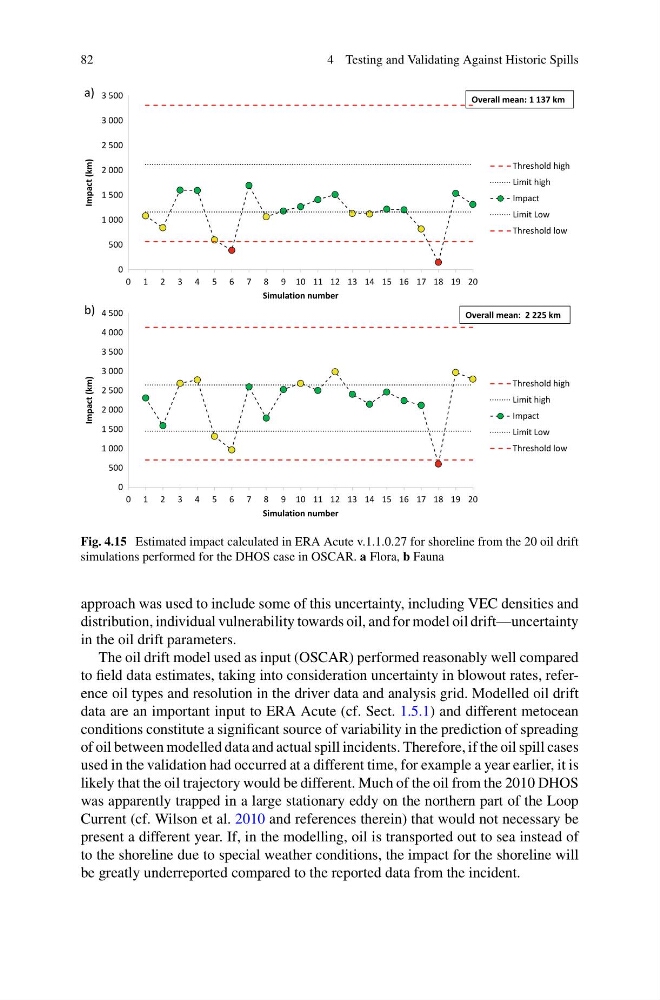
Fig. 4.15 Estimated impact calculated in ERA Acute v.1.1.0.27 for shoreline from the 20 oil drift
simulations performed for the DHOS case in OSCAR. a Flora, b Fauna
approach was used to include some of this uncertainty, including VEC densities and
distribution, individual vulnerability towards oil, and for model oil drift—uncertainty
in the oil drift parameters.
The oil drift model used as input (OSCAR) performed reasonably well compared
to field data estimates, taking into consideration uncertainty in blowout rates, reference oil types and resolution in the driver data and analysis grid. Modelled oil drift
data are an important input to ERA Acute (cf. Sect. 1.5.1) and different metocean
conditions constitute a significant source of variability in the prediction of spreading
of oil between modelled data and actual spill incidents. Therefore, if the oil spill cases
used in the validation had occurred at a different time, for example a year earlier, it is
likely that the oil trajectory would be different. Much of the oil from the 2010 DHOS
was apparently trapped in a large stationary eddy on the northern part of the Loop
Current (cf. Wilson et al. 2010 and references therein) that would not necessary be
present a different year. If, in the modelling, oil is transported out to sea instead of
to the shoreline due to special weather conditions, the impact for the shoreline will
be greatly underreported compared to the reported data from the incident.
4 Testing and Validating Against Historic Spills
a)
b)
0
500
1 000
1 500
2 000
2 500
3 000
3 500
0 1 2 3 4 5 6 7 8 9 10 11 12 13 14 15 16 17 18 19 20
Impact (km)
Simulation number
Threshold high
Limit high
Impact
Limit Low
Threshold low
Overall mean: 1 137 km
0
500
1 000
1 500
2 000
2 500
3 000
3 500
4 000
4 500
0 1 2 3 4 5 6 7 8 9 10 11 12 13 14 15 16 17 18 19 20
Impact (km)
Simulation number
Threshold high
Limit high
Impact
Limit Low
Threshold low
Overall mean: 2 225 km
Fig. 4.15 Estimated impact calculated in ERA Acute v.1.1.0.27 for shoreline from the 20 oil drift
simulations performed for the DHOS case in OSCAR. a Flora, b Fauna
approach was used to include some of this uncertainty, including VEC densities and
distribution, individual vulnerability towards oil, and for model oil drift—uncertainty
in the oil drift parameters.
The oil drift model used as input (OSCAR) performed reasonably well compared
to field data estimates, taking into consideration uncertainty in blowout rates, reference oil types and resolution in the driver data and analysis grid. Modelled oil drift
data are an important input to ERA Acute (cf. Sect. 1.5.1) and different metocean
conditions constitute a significant source of variability in the prediction of spreading
of oil between modelled data and actual spill incidents. Therefore, if the oil spill cases
used in the validation had occurred at a different time, for example a year earlier, it is
likely that the oil trajectory would be different. Much of the oil from the 2010 DHOS
was apparently trapped in a large stationary eddy on the northern part of the Loop
Current (cf. Wilson et al. 2010 and references therein) that would not necessary be
present a different year. If, in the modelling, oil is transported out to sea instead of
to the shoreline due to special weather conditions, the impact for the shoreline will
be greatly underreported compared to the reported data from the incident.