

42
3 An ERA Acute Model Overview
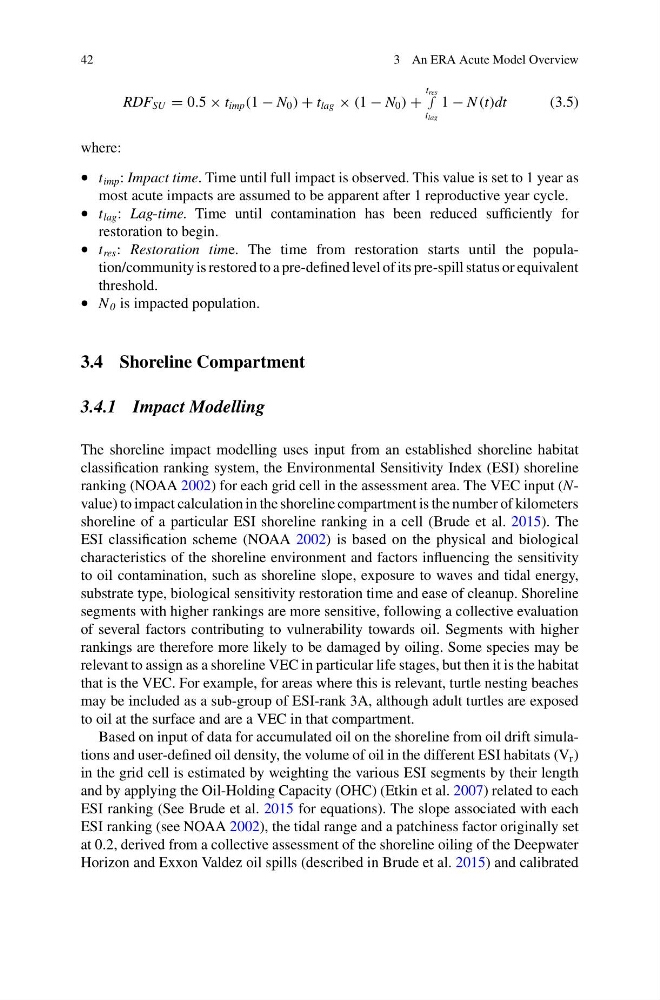
RDF SU = 0.5 × t imp (1 − N 0 ) + t lag × (1 − N 0 ) +
t res
∫
t lag
1 − N (t)dt
(3.5)
where:
• t imp : Impact time. Time until full impact is observed. This value is set to 1 year as
most acute impacts are assumed to be apparent after 1 reproductive year cycle.
• t lag : Lag-time. Time until contamination has been reduced sufficiently for
restoration to begin.
• t res : Restoration time. The time from restoration starts until the population/community is restored to a pre-defined level of its pre-spill status or equivalent
threshold.
• N 0 is impacted population.
3.4 Shoreline Compartment
3.4.1 Impact Modelling
The shoreline impact modelling uses input from an established shoreline habitat
classification ranking system, the Environmental Sensitivity Index (ESI) shoreline
ranking (NOAA 2002) for each grid cell in the assessment area. The VEC input (Nvalue) to impact calculation in the shoreline compartment is the number of kilometers
shoreline of a particular ESI shoreline ranking in a cell (Brude et al. 2015). The
ESI classification scheme (NOAA 2002) is based on the physical and biological
characteristics of the shoreline environment and factors influencing the sensitivity
to oil contamination, such as shoreline slope, exposure to waves and tidal energy,
substrate type, biological sensitivity restoration time and ease of cleanup. Shoreline
segments with higher rankings are more sensitive, following a collective evaluation
of several factors contributing to vulnerability towards oil. Segments with higher
rankings are therefore more likely to be damaged by oiling. Some species may be
relevant to assign as a shoreline VEC in particular life stages, but then it is the habitat
that is the VEC. For example, for areas where this is relevant, turtle nesting beaches
may be included as a sub-group of ESI-rank 3A, although adult turtles are exposed
to oil at the surface and are a VEC in that compartment.
Based on input of data for accumulated oil on the shoreline from oil drift simulations and user-defined oil density, the volume of oil in the different ESI habitats (V r )
in the grid cell is estimated by weighting the various ESI segments by their length
and by applying the Oil-Holding Capacity (OHC) (Etkin et al. 2007) related to each
ESI ranking (See Brude et al. 2015 for equations). The slope associated with each
ESI ranking (see NOAA 2002), the tidal range and a patchiness factor originally set
at 0.2, derived from a collective assessment of the shoreline oiling of the Deepwater
Horizon and Exxon Valdez oil spills (described in Brude et al. 2015) and calibrated
3 An ERA Acute Model Overview
RDF SU = 0.5 × t imp (1 − N 0 ) + t lag × (1 − N 0 ) +
t res
∫
t lag
1 − N (t)dt
(3.5)
where:
• t imp : Impact time. Time until full impact is observed. This value is set to 1 year as
most acute impacts are assumed to be apparent after 1 reproductive year cycle.
• t lag : Lag-time. Time until contamination has been reduced sufficiently for
restoration to begin.
• t res : Restoration time. The time from restoration starts until the population/community is restored to a pre-defined level of its pre-spill status or equivalent
threshold.
• N 0 is impacted population.
3.4 Shoreline Compartment
3.4.1 Impact Modelling
The shoreline impact modelling uses input from an established shoreline habitat
classification ranking system, the Environmental Sensitivity Index (ESI) shoreline
ranking (NOAA 2002) for each grid cell in the assessment area. The VEC input (Nvalue) to impact calculation in the shoreline compartment is the number of kilometers
shoreline of a particular ESI shoreline ranking in a cell (Brude et al. 2015). The
ESI classification scheme (NOAA 2002) is based on the physical and biological
characteristics of the shoreline environment and factors influencing the sensitivity
to oil contamination, such as shoreline slope, exposure to waves and tidal energy,
substrate type, biological sensitivity restoration time and ease of cleanup. Shoreline
segments with higher rankings are more sensitive, following a collective evaluation
of several factors contributing to vulnerability towards oil. Segments with higher
rankings are therefore more likely to be damaged by oiling. Some species may be
relevant to assign as a shoreline VEC in particular life stages, but then it is the habitat
that is the VEC. For example, for areas where this is relevant, turtle nesting beaches
may be included as a sub-group of ESI-rank 3A, although adult turtles are exposed
to oil at the surface and are a VEC in that compartment.
Based on input of data for accumulated oil on the shoreline from oil drift simulations and user-defined oil density, the volume of oil in the different ESI habitats (V r )
in the grid cell is estimated by weighting the various ESI segments by their length
and by applying the Oil-Holding Capacity (OHC) (Etkin et al. 2007) related to each
ESI ranking (See Brude et al. 2015 for equations). The slope associated with each
ESI ranking (see NOAA 2002), the tidal range and a patchiness factor originally set
at 0.2, derived from a collective assessment of the shoreline oiling of the Deepwater
Horizon and Exxon Valdez oil spills (described in Brude et al. 2015) and calibrated