

38
3 An ERA Acute Model Overview
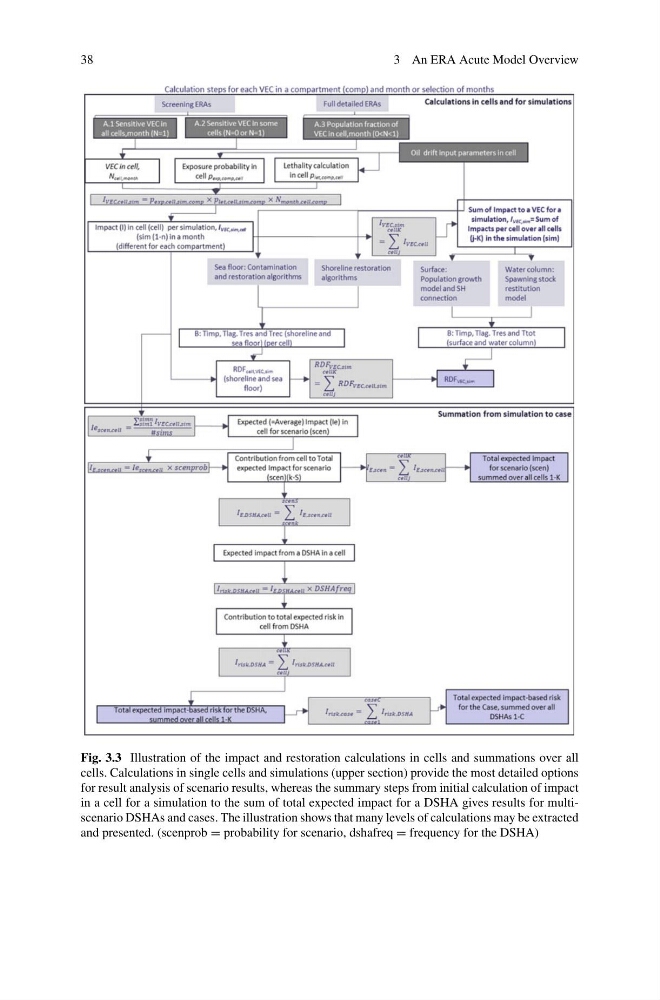
Fig. 3.3 Illustration of the impact and restoration calculations in cells and summations over all
cells. Calculations in single cells and simulations (upper section) provide the most detailed options
for result analysis of scenario results, whereas the summary steps from initial calculation of impact
in a cell for a simulation to the sum of total expected impact for a DSHA gives results for multiscenario DSHAs and cases. The illustration shows that many levels of calculations may be extracted
and presented. (scenprob = probability for scenario, dshafreq = frequency for the DSHA)
3 An ERA Acute Model Overview
Fig. 3.3 Illustration of the impact and restoration calculations in cells and summations over all
cells. Calculations in single cells and simulations (upper section) provide the most detailed options
for result analysis of scenario results, whereas the summary steps from initial calculation of impact
in a cell for a simulation to the sum of total expected impact for a DSHA gives results for multiscenario DSHAs and cases. The illustration shows that many levels of calculations may be extracted
and presented. (scenprob = probability for scenario, dshafreq = frequency for the DSHA)