

3.2 Impact and Restoration Modelling
35
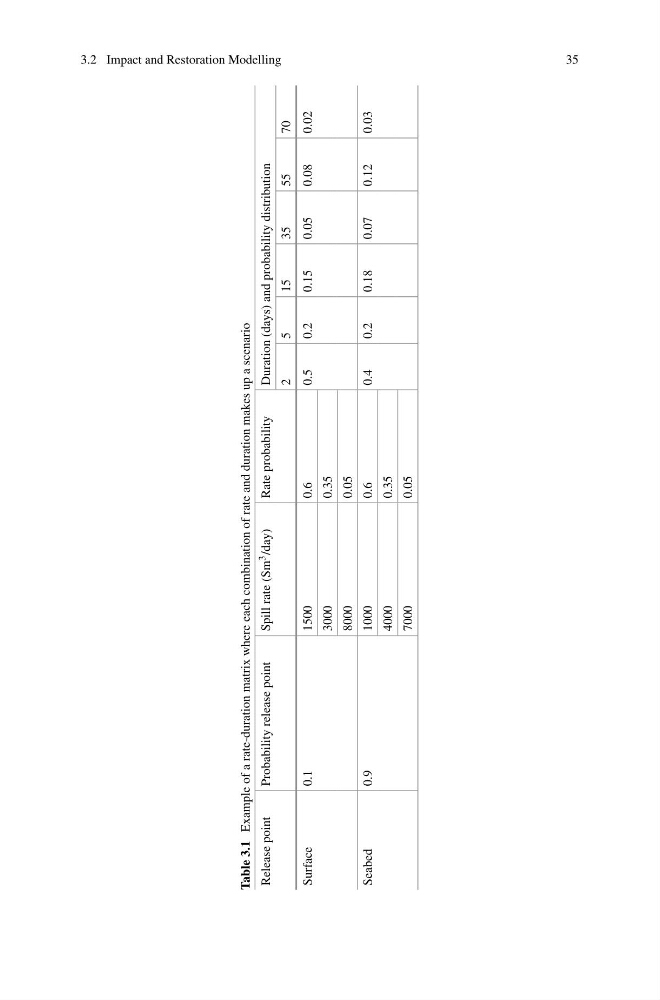
Table 3.1
Example of a rate-duration matrix where each combination of rate and duration makes up a scenario
Release point
Probability release point
Spill rate (Sm 3
/day)
Rate probability
Duration (days) and probability distribution
2
5
15
35
55
70
Surface
0.1
1500
0.6
0.5
0.2
0.15
0.05
0.08
0.02
3000
0.35
8000
0.05
Seabed
0.9
1000
0.6
0.4
0.2
0.18
0.07
0.12
0.03
4000
0.35
7000
0.05
35
Table 3.1
Example of a rate-duration matrix where each combination of rate and duration makes up a scenario
Release point
Probability release point
Spill rate (Sm 3
/day)
Rate probability
Duration (days) and probability distribution
2
5
15
35
55
70
Surface
0.1
1500
0.6
0.5
0.2
0.15
0.05
0.08
0.02
3000
0.35
8000
0.05
Seabed
0.9
1000
0.6
0.4
0.2
0.18
0.07
0.12
0.03
4000
0.35
7000
0.05