

10
1 Introduction to the Concepts and Use of ERA Acute
1.4.2.3 Analysis Level A.3 Impact Analysis
VEC input data at the highest level are gridded to the same standardized format as oil
spill trajectory simulations, containing VEC population (or equivalent) fractions in
each cell. Each VEC is ascribed to the compartment where the main impact occurs.
The parameter values used for the VECs can be changed where relevant, e.g. for
different regions, but globally applicable default values are available.
In order to calculate the most detailed potential impact and recovery of a VEC,
its distribution needs to be mapped into the same grid cells as the oil drift output.
For a population, each grid cell will have a value representing the fraction of the
population present in that cell. Environmental risk will vary between seasons with
the VEC distribution, the VEC distribution data therefore have a monthly resolution.
For shorelines, the shoreline length of each ESI ranking (NOAA 2002) in each grid
cell is used as the VEC unit. For seafloor habitats and/or communities, the area
distribution in km
2 within each seafloor grid cell is used.
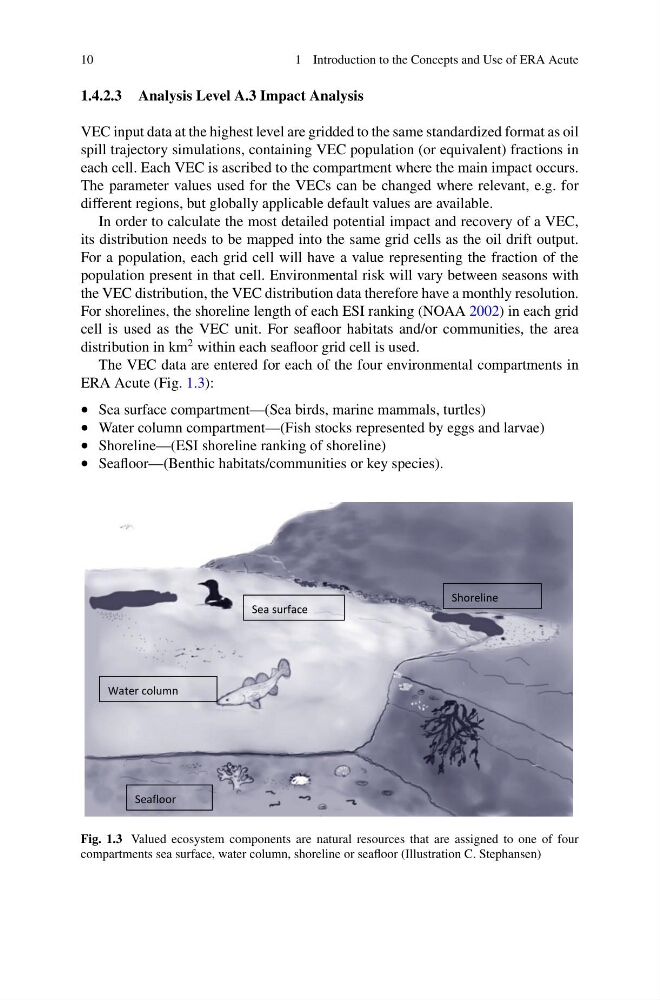
The VEC data are entered for each of the four environmental compartments in
ERA Acute (Fig. 1.3):
• Sea surface compartment—(Sea birds, marine mammals, turtles)
• Water column compartment—(Fish stocks represented by eggs and larvae)
• Shoreline—(ESI shoreline ranking of shoreline)
• Seafloor—(Benthic habitats/communities or key species).
Sea surface
Water column
Seafloor
Shoreline
Fig. 1.3 Valued ecosystem components are natural resources that are assigned to one of four
compartments sea surface, water column, shoreline or seafloor (Illustration C. Stephansen)
1 Introduction to the Concepts and Use of ERA Acute
1.4.2.3 Analysis Level A.3 Impact Analysis
VEC input data at the highest level are gridded to the same standardized format as oil
spill trajectory simulations, containing VEC population (or equivalent) fractions in
each cell. Each VEC is ascribed to the compartment where the main impact occurs.
The parameter values used for the VECs can be changed where relevant, e.g. for
different regions, but globally applicable default values are available.
In order to calculate the most detailed potential impact and recovery of a VEC,
its distribution needs to be mapped into the same grid cells as the oil drift output.
For a population, each grid cell will have a value representing the fraction of the
population present in that cell. Environmental risk will vary between seasons with
the VEC distribution, the VEC distribution data therefore have a monthly resolution.
For shorelines, the shoreline length of each ESI ranking (NOAA 2002) in each grid
cell is used as the VEC unit. For seafloor habitats and/or communities, the area
distribution in km
2 within each seafloor grid cell is used.
The VEC data are entered for each of the four environmental compartments in
ERA Acute (Fig. 1.3):
• Sea surface compartment—(Sea birds, marine mammals, turtles)
• Water column compartment—(Fish stocks represented by eggs and larvae)
• Shoreline—(ESI shoreline ranking of shoreline)
• Seafloor—(Benthic habitats/communities or key species).
Sea surface
Water column
Seafloor
Shoreline
Fig. 1.3 Valued ecosystem components are natural resources that are assigned to one of four
compartments sea surface, water column, shoreline or seafloor (Illustration C. Stephansen)