

2.5 Optical Properties
55
HOMO
(-4.336 eV)
LUMO
(-1.666 eV)
LUMO+1
(-1.532 eV)
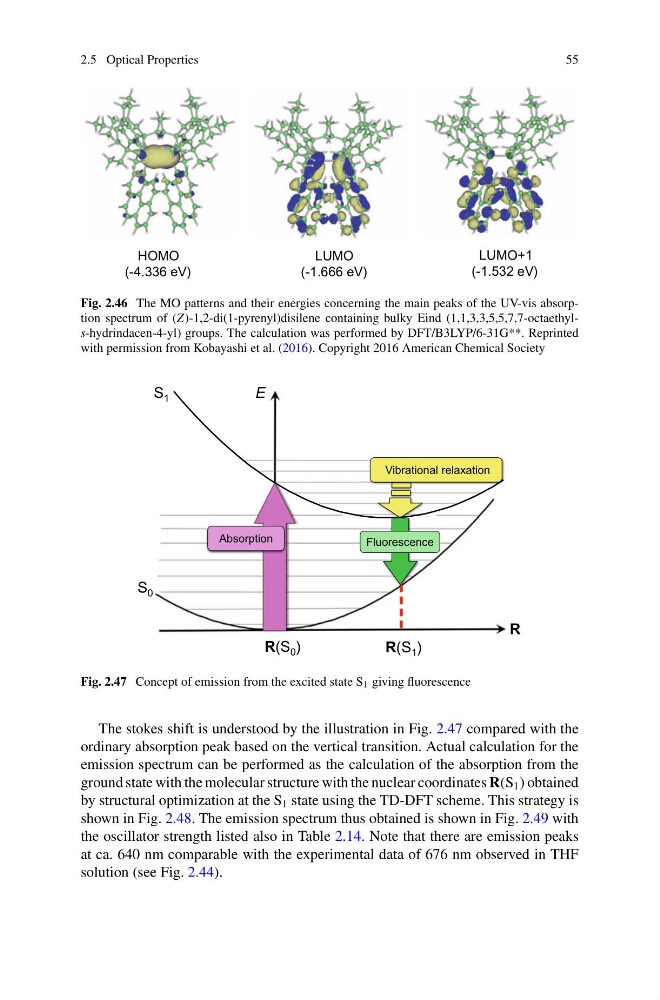
Fig. 2.46 The MO patterns and their energies concerning the main peaks of the UV-vis absorption spectrum of (Z)-1,2-di(1-pyrenyl)disilene containing bulky Eind (1,1,3,3,5,5,7,7-octaethyls-hydrindacen-4-yl) groups. The calculation was performed by DFT/B3LYP/6-31G**. Reprinted
with permission from Kobayashi et al. (2016). Copyright 2016 American Chemical Society
Absorption
Vibrational relaxation
R(S 0 )
R(S 1 )
R
E
S 1
S 0
Fluorescence
Fig. 2.47 Concept of emission from the excited state S 1 giving fluorescence
The stokes shift is understood by the illustration in Fig. 2.47 compared with the
ordinary absorption peak based on the vertical transition. Actual calculation for the
emission spectrum can be performed as the calculation of the absorption from the
ground state with the molecular structure with the nuclear coordinates R(S 1 ) obtained
by structural optimization at the S 1 state using the TD-DFT scheme. This strategy is
shown in Fig. 2.48. The emission spectrum thus obtained is shown in Fig. 2.49 with
the oscillator strength listed also in Table 2.14. Note that there are emission peaks
at ca. 640 nm comparable with the experimental data of 676 nm observed in THF
solution (see Fig. 2.44).
55
HOMO
(-4.336 eV)
LUMO
(-1.666 eV)
LUMO+1
(-1.532 eV)
Fig. 2.46 The MO patterns and their energies concerning the main peaks of the UV-vis absorption spectrum of (Z)-1,2-di(1-pyrenyl)disilene containing bulky Eind (1,1,3,3,5,5,7,7-octaethyls-hydrindacen-4-yl) groups. The calculation was performed by DFT/B3LYP/6-31G**. Reprinted
with permission from Kobayashi et al. (2016). Copyright 2016 American Chemical Society
Absorption
Vibrational relaxation
R(S 0 )
R(S 1 )
R
E
S 1
S 0
Fluorescence
Fig. 2.47 Concept of emission from the excited state S 1 giving fluorescence
The stokes shift is understood by the illustration in Fig. 2.47 compared with the
ordinary absorption peak based on the vertical transition. Actual calculation for the
emission spectrum can be performed as the calculation of the absorption from the
ground state with the molecular structure with the nuclear coordinates R(S 1 ) obtained
by structural optimization at the S 1 state using the TD-DFT scheme. This strategy is
shown in Fig. 2.48. The emission spectrum thus obtained is shown in Fig. 2.49 with
the oscillator strength listed also in Table 2.14. Note that there are emission peaks
at ca. 640 nm comparable with the experimental data of 676 nm observed in THF
solution (see Fig. 2.44).