

2.5 Optical Properties
53
HOMO-1
-7.6880 eV
HOMO
-7.6875 eV
LUMO
-0.2014 eV
LUMO+1
-0.2008 eV
Fig. 2.43 MO patterns and their energies concerning the main peak of the UV-vis absorption of the
benzotrithiophene derivative in MCH solution (C 1 symmetry) obtained by DFT/ωB97X-D/6-31G**
Absorption in THF
(575 nm)
Eind
Eind
Eind
Si
Si
Emission in
THF
(676 nm)
Solid-state
emission
(712 nm)
(Absorption by
pyrene ring
(350 nm)
Wavelength (nm)
Normalized fluorescent intensity (au)
E ( / M cm)
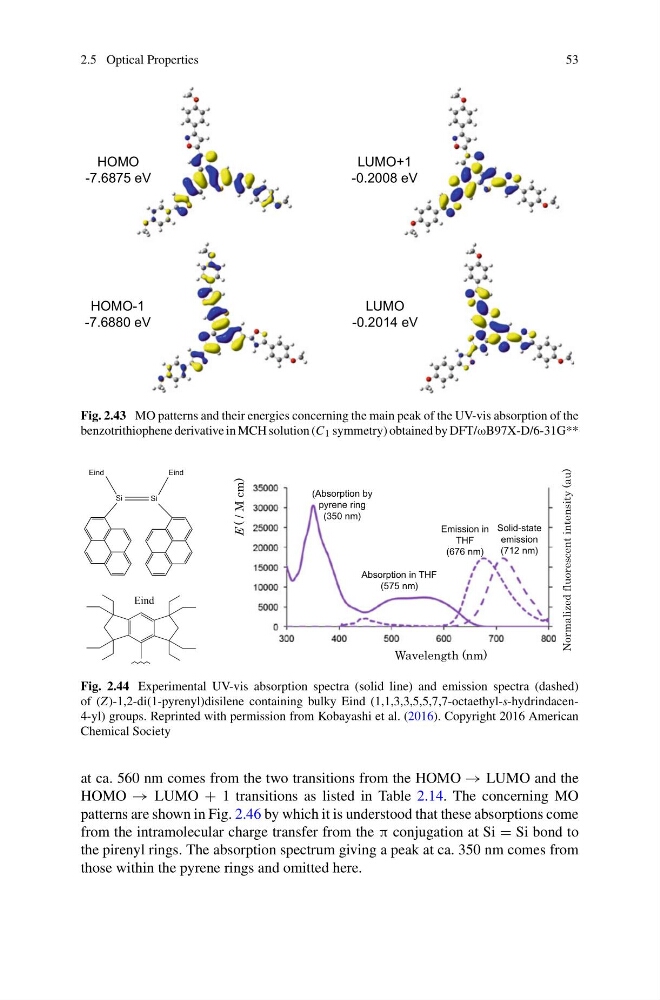
Fig. 2.44 Experimental UV-vis absorption spectra (solid line) and emission spectra (dashed)
of (Z)-1,2-di(1-pyrenyl)disilene containing bulky Eind (1,1,3,3,5,5,7,7-octaethyl-s-hydrindacen4-yl) groups. Reprinted with permission from Kobayashi et al. (2016). Copyright 2016 American
Chemical Society
at ca. 560 nm comes from the two transitions from the HOMO → LUMO and the
HOMO → LUMO + 1 transitions as listed in Table 2.14. The concerning MO
patterns are shown in Fig. 2.46 by which it is understood that these absorptions come
from the intramolecular charge transfer from the π conjugation at Si = Si bond to
the pirenyl rings. The absorption spectrum giving a peak at ca. 350 nm comes from
those within the pyrene rings and omitted here.
53
HOMO-1
-7.6880 eV
HOMO
-7.6875 eV
LUMO
-0.2014 eV
LUMO+1
-0.2008 eV
Fig. 2.43 MO patterns and their energies concerning the main peak of the UV-vis absorption of the
benzotrithiophene derivative in MCH solution (C 1 symmetry) obtained by DFT/ωB97X-D/6-31G**
Absorption in THF
(575 nm)
Eind
Eind
Eind
Si
Si
Emission in
THF
(676 nm)
Solid-state
emission
(712 nm)
(Absorption by
pyrene ring
(350 nm)
Wavelength (nm)
Normalized fluorescent intensity (au)
E ( / M cm)
Fig. 2.44 Experimental UV-vis absorption spectra (solid line) and emission spectra (dashed)
of (Z)-1,2-di(1-pyrenyl)disilene containing bulky Eind (1,1,3,3,5,5,7,7-octaethyl-s-hydrindacen4-yl) groups. Reprinted with permission from Kobayashi et al. (2016). Copyright 2016 American
Chemical Society
at ca. 560 nm comes from the two transitions from the HOMO → LUMO and the
HOMO → LUMO + 1 transitions as listed in Table 2.14. The concerning MO
patterns are shown in Fig. 2.46 by which it is understood that these absorptions come
from the intramolecular charge transfer from the π conjugation at Si = Si bond to
the pirenyl rings. The absorption spectrum giving a peak at ca. 350 nm comes from
those within the pyrene rings and omitted here.