

2.5 Optical Properties
51
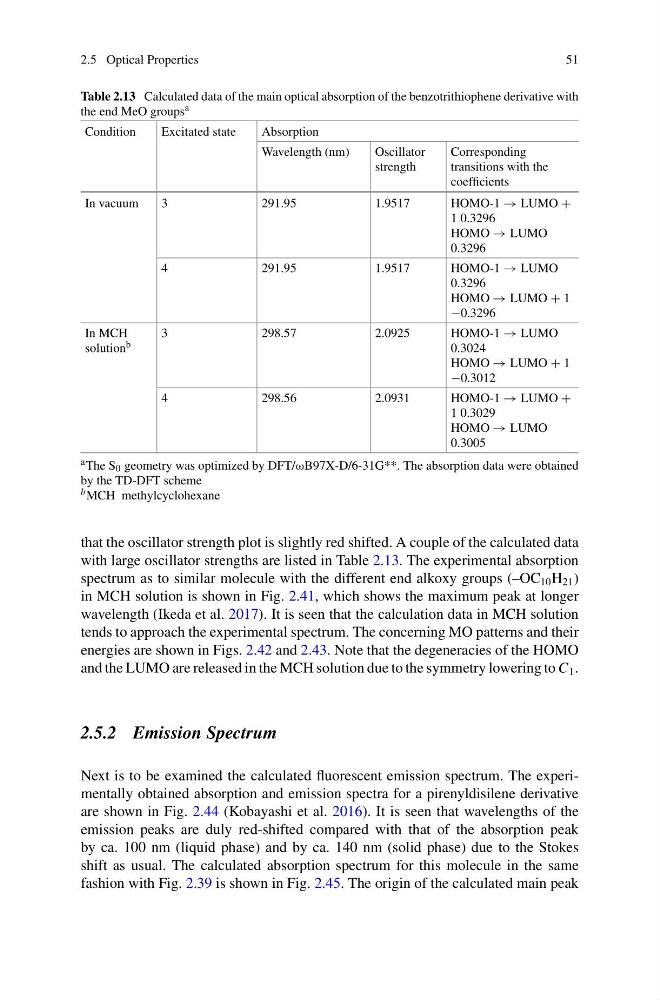
Table 2.13 Calculated data of the main optical absorption of the benzotrithiophene derivative with
the end MeO groups a
Condition
Excitated state
Absorption
Wavelength (nm)
Oscillator
strength
Corresponding
transitions with the
coefficients
In vacuum
3
291.95
1.9517
HOMO-1 → LUMO +
1 0.3296
HOMO → LUMO
0.3296
4
291.95
1.9517
HOMO-1 → LUMO
0.3296
HOMO → LUMO + 1
−0.3296
In MCH
solution b
3
298.57
2.0925
HOMO-1 → LUMO
0.3024
HOMO → LUMO + 1
−0.3012
4
298.56
2.0931
HOMO-1 → LUMO +
1 0.3029
HOMO → LUMO
0.3005
a The S 0 geometry was optimized by DFT/ωB97X-D/6-31G**. The absorption data were obtained
by the TD-DFT scheme
b MCH methylcyclohexane
that the oscillator strength plot is slightly red shifted. A couple of the calculated data
with large oscillator strengths are listed in Table 2.13. The experimental absorption
spectrum as to similar molecule with the different end alkoxy groups (–OC 10 H 21 )
in MCH solution is shown in Fig. 2.41, which shows the maximum peak at longer
wavelength (Ikeda et al. 2017). It is seen that the calculation data in MCH solution
tends to approach the experimental spectrum. The concerning MO patterns and their
energies are shown in Figs. 2.42 and 2.43. Note that the degeneracies of the HOMO
and the LUMO are released in the MCH solution due to the symmetry lowering to C 1 .
2.5.2 Emission Spectrum
Next is to be examined the calculated fluorescent emission spectrum. The experimentally obtained absorption and emission spectra for a pirenyldisilene derivative
are shown in Fig. 2.44 (Kobayashi et al. 2016). It is seen that wavelengths of the
emission peaks are duly red-shifted compared with that of the absorption peak
by ca. 100 nm (liquid phase) and by ca. 140 nm (solid phase) due to the Stokes
shift as usual. The calculated absorption spectrum for this molecule in the same
fashion with Fig. 2.39 is shown in Fig. 2.45. The origin of the calculated main peak
51
Table 2.13 Calculated data of the main optical absorption of the benzotrithiophene derivative with
the end MeO groups a
Condition
Excitated state
Absorption
Wavelength (nm)
Oscillator
strength
Corresponding
transitions with the
coefficients
In vacuum
3
291.95
1.9517
HOMO-1 → LUMO +
1 0.3296
HOMO → LUMO
0.3296
4
291.95
1.9517
HOMO-1 → LUMO
0.3296
HOMO → LUMO + 1
−0.3296
In MCH
solution b
3
298.57
2.0925
HOMO-1 → LUMO
0.3024
HOMO → LUMO + 1
−0.3012
4
298.56
2.0931
HOMO-1 → LUMO +
1 0.3029
HOMO → LUMO
0.3005
a The S 0 geometry was optimized by DFT/ωB97X-D/6-31G**. The absorption data were obtained
by the TD-DFT scheme
b MCH methylcyclohexane
that the oscillator strength plot is slightly red shifted. A couple of the calculated data
with large oscillator strengths are listed in Table 2.13. The experimental absorption
spectrum as to similar molecule with the different end alkoxy groups (–OC 10 H 21 )
in MCH solution is shown in Fig. 2.41, which shows the maximum peak at longer
wavelength (Ikeda et al. 2017). It is seen that the calculation data in MCH solution
tends to approach the experimental spectrum. The concerning MO patterns and their
energies are shown in Figs. 2.42 and 2.43. Note that the degeneracies of the HOMO
and the LUMO are released in the MCH solution due to the symmetry lowering to C 1 .
2.5.2 Emission Spectrum
Next is to be examined the calculated fluorescent emission spectrum. The experimentally obtained absorption and emission spectra for a pirenyldisilene derivative
are shown in Fig. 2.44 (Kobayashi et al. 2016). It is seen that wavelengths of the
emission peaks are duly red-shifted compared with that of the absorption peak
by ca. 100 nm (liquid phase) and by ca. 140 nm (solid phase) due to the Stokes
shift as usual. The calculated absorption spectrum for this molecule in the same
fashion with Fig. 2.39 is shown in Fig. 2.45. The origin of the calculated main peak