

3.3 Crystal Orbital (CO) Calculations
125
3.3.4 Energy Band
The CO expressed by Eq. (3.39) is accompanied by energies ε s (k) being a function of
the wave vector k. One may sometimes see bizarre drawings named “energy band” or
“band structure” for most of the crystal systems including a 1D polymer. This image
is one of the typical and crucial key parts describing and characterizing the electronic
properties of the 1D polymer as well. The energy band is a conventional expression
method for the collection of energies ε s (k) with respect to each s and function of k
in the Brillouin zone above mentioned.
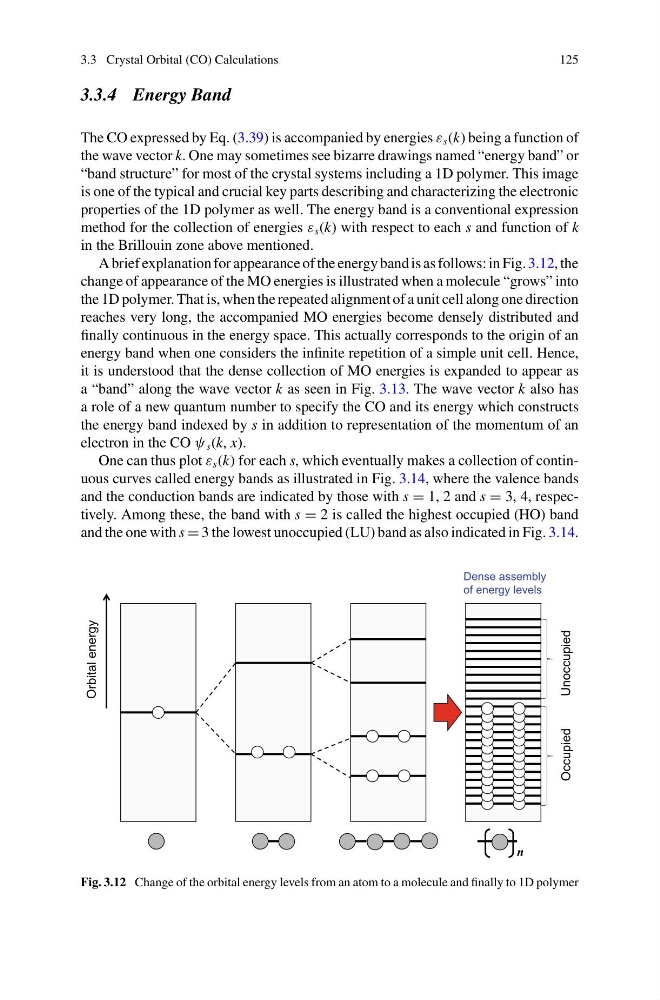
A brief explanation for appearance of the energy band is as follows: in Fig. 3.12, the
change of appearance of the MO energies is illustrated when a molecule “grows” into
the 1D polymer. That is, when the repeated alignment of a unit cell along one direction
reaches very long, the accompanied MO energies become densely distributed and
finally continuous in the energy space. This actually corresponds to the origin of an
energy band when one considers the infinite repetition of a simple unit cell. Hence,
it is understood that the dense collection of MO energies is expanded to appear as
a “band” along the wave vector k as seen in Fig. 3.13. The wave vector k also has
a role of a new quantum number to specify the CO and its energy which constructs
the energy band indexed by s in addition to representation of the momentum of an
electron in the CO ψ s (k, x).
One can thus plot ε s (k) for each s, which eventually makes a collection of continuous curves called energy bands as illustrated in Fig. 3.14, where the valence bands
and the conduction bands are indicated by those with s = 1, 2 and s = 3, 4, respectively. Among these, the band with s = 2 is called the highest occupied (HO) band
and the one with s = 3 the lowest unoccupied (LU) band as also indicated in Fig. 3.14.
n
Orbital energy
Dense assembly
of energy levels
Occupied
Unoccupied
Fig. 3.12 Change of the orbital energy levels from an atom to a molecule and finally to 1D polymer
125
3.3.4 Energy Band
The CO expressed by Eq. (3.39) is accompanied by energies ε s (k) being a function of
the wave vector k. One may sometimes see bizarre drawings named “energy band” or
“band structure” for most of the crystal systems including a 1D polymer. This image
is one of the typical and crucial key parts describing and characterizing the electronic
properties of the 1D polymer as well. The energy band is a conventional expression
method for the collection of energies ε s (k) with respect to each s and function of k
in the Brillouin zone above mentioned.
A brief explanation for appearance of the energy band is as follows: in Fig. 3.12, the
change of appearance of the MO energies is illustrated when a molecule “grows” into
the 1D polymer. That is, when the repeated alignment of a unit cell along one direction
reaches very long, the accompanied MO energies become densely distributed and
finally continuous in the energy space. This actually corresponds to the origin of an
energy band when one considers the infinite repetition of a simple unit cell. Hence,
it is understood that the dense collection of MO energies is expanded to appear as
a “band” along the wave vector k as seen in Fig. 3.13. The wave vector k also has
a role of a new quantum number to specify the CO and its energy which constructs
the energy band indexed by s in addition to representation of the momentum of an
electron in the CO ψ s (k, x).
One can thus plot ε s (k) for each s, which eventually makes a collection of continuous curves called energy bands as illustrated in Fig. 3.14, where the valence bands
and the conduction bands are indicated by those with s = 1, 2 and s = 3, 4, respectively. Among these, the band with s = 2 is called the highest occupied (HO) band
and the one with s = 3 the lowest unoccupied (LU) band as also indicated in Fig. 3.14.
n
Orbital energy
Dense assembly
of energy levels
Occupied
Unoccupied
Fig. 3.12 Change of the orbital energy levels from an atom to a molecule and finally to 1D polymer