

② Due to close hydraulic correlations with the leachate, the 1st layer of
groundwater at the landfill site is polluted the most seriously. Among the
conventional indicators, more than 75% of the samples exceeded the standard
limits of COD cr , ammonia-nitrogen, total nitrogen, total phosphorus, total
hardness, dissolved solids, potassium permanganate, SO 4
2− , Cl
− and total
coliforms. In particular, COD Cr , BOD 5 , ammonia-nitrogen and total coliforms
exceeded more than 5 times of the standard limits at maximum.
③ The 2nd layer of groundwater in the landfill has also been contaminated by the
upper landfill leachate. According to analysis, this is because the anti-pollution
barrier between the garbage dump and the 2nd layer of groundwater aquifer is
thin and composed of silt, resulting in poor anti-pollution performance as the
landfill leachate can easily infiltrate through the barrier into the 2nd layer of
groundwater. In the 2nd layer of groundwater, 33–100% of the samples
exceeded the standard limits of 10 indicators including chromaticity, total
hardness, dissolved solids, potassium permanganate index, SO 4
2− , Cl
− ,
volatile phenols, ammonia-nitrogen, NO 2
− , total coliforms and Na
+
, to the 3–
23 times of the standard limits, and in particular, the limits of
ammonia-nitrogen and total nitrogen are exceeded by astounding 10,199 and
2569 times respectively.
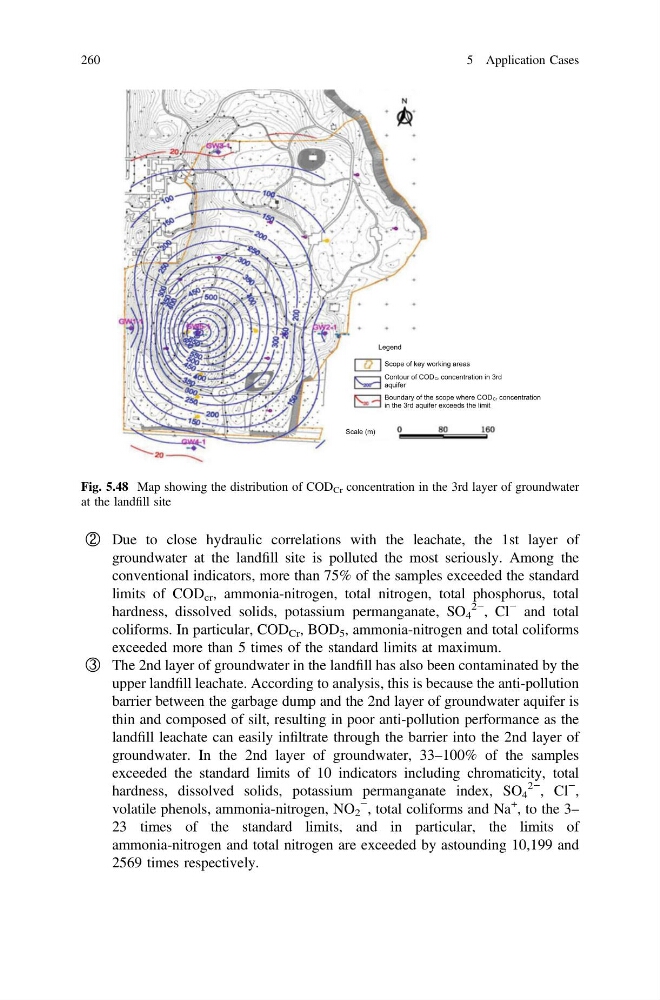
Legend
Scope of key working areas
Scale (m)
Contour of CODCr concentration in 3rd
aquifer
Boundary of the scope where CODCr concentration
in the 3rd aquifer exceeds the limit
Fig. 5.48 Map showing the distribution of COD Cr concentration in the 3rd layer of groundwater
at the landfill site
260
5 Application Cases
groundwater at the landfill site is polluted the most seriously. Among the
conventional indicators, more than 75% of the samples exceeded the standard
limits of COD cr , ammonia-nitrogen, total nitrogen, total phosphorus, total
hardness, dissolved solids, potassium permanganate, SO 4
2− , Cl
− and total
coliforms. In particular, COD Cr , BOD 5 , ammonia-nitrogen and total coliforms
exceeded more than 5 times of the standard limits at maximum.
③ The 2nd layer of groundwater in the landfill has also been contaminated by the
upper landfill leachate. According to analysis, this is because the anti-pollution
barrier between the garbage dump and the 2nd layer of groundwater aquifer is
thin and composed of silt, resulting in poor anti-pollution performance as the
landfill leachate can easily infiltrate through the barrier into the 2nd layer of
groundwater. In the 2nd layer of groundwater, 33–100% of the samples
exceeded the standard limits of 10 indicators including chromaticity, total
hardness, dissolved solids, potassium permanganate index, SO 4
2− , Cl
− ,
volatile phenols, ammonia-nitrogen, NO 2
− , total coliforms and Na
+
, to the 3–
23 times of the standard limits, and in particular, the limits of
ammonia-nitrogen and total nitrogen are exceeded by astounding 10,199 and
2569 times respectively.
Legend
Scope of key working areas
Scale (m)
Contour of CODCr concentration in 3rd
aquifer
Boundary of the scope where CODCr concentration
in the 3rd aquifer exceeds the limit
Fig. 5.48 Map showing the distribution of COD Cr concentration in the 3rd layer of groundwater
at the landfill site
260
5 Application Cases