

② Unbalanced nutrition ratio
According to the analysis data of physical composition of municipal domestic
refuse in A city of a province in Southeast China by an integrated refuse disposal
plant in A city of a province in Southeast China in recent years (see Table 5.73), the
proportion of organic matter, inorganic matter and recyclable matter in municipal
domestic refuse is 43.04%, 17.14% and 32.38% respectively, mainly organic
matter, followed by recyclable matter.
Researches show that, when the content of furnace dust in the refuse is similar, if
the content of kitchen waste is higher, the concentrations of COD, BOD 5 and NH 3 –
N in leachate are higher. The concentrations of COD, BOD 5 and NH 3 –N in certain
landfill leachate are generally high, with irregular changes (as shown in Figs. 5.34,
5.35, 5.36, 5.37 and 5.38), and the C/N ratio in the leachate is low, ranging from 2.9
to 5.6, far below 20, which is not conducive to biochemical degradation. NH 3 –N
Table 5.72 Water quality and quantity analysis data of landfill leachate
Time
No.
COD Cr
BOD 5
NH 3 -N
PH
Organic
acid
Water quantity
(10,000 t)
1998
1
2237
983
756
7.3
519
33.84
1999
2
2450
1083
735
7.1
552
32.56
2000
3
2875
1658
768
7.5
558
34.78
2001
4
2842
1780
841
7.6
710
36.52
2002
5
3467
1823
835
7.9
864
35.89
2003
6
4962
2578
878
7.7
858
38.45
2004
7
3120
2032
945
7.9
951
39.83
2005
8
3670
1876
978
8.1
941
40.82
2006
9
4875
2657
1062
7.8
870
38.79
2007
10
3168
2011
1152
7.7
869
38.67
2008
11
5236
2875
1256
7.8
942
39.41
2009
12
4354
2326
1034
7.8
912
33.56
2010
13
3256
1883
822
7.9
978
30.25
Note The above data are annual average, COD Cr , BOD 5 , NH 3 –N, organic acid are in ml/L, and the
water quantity is annual total
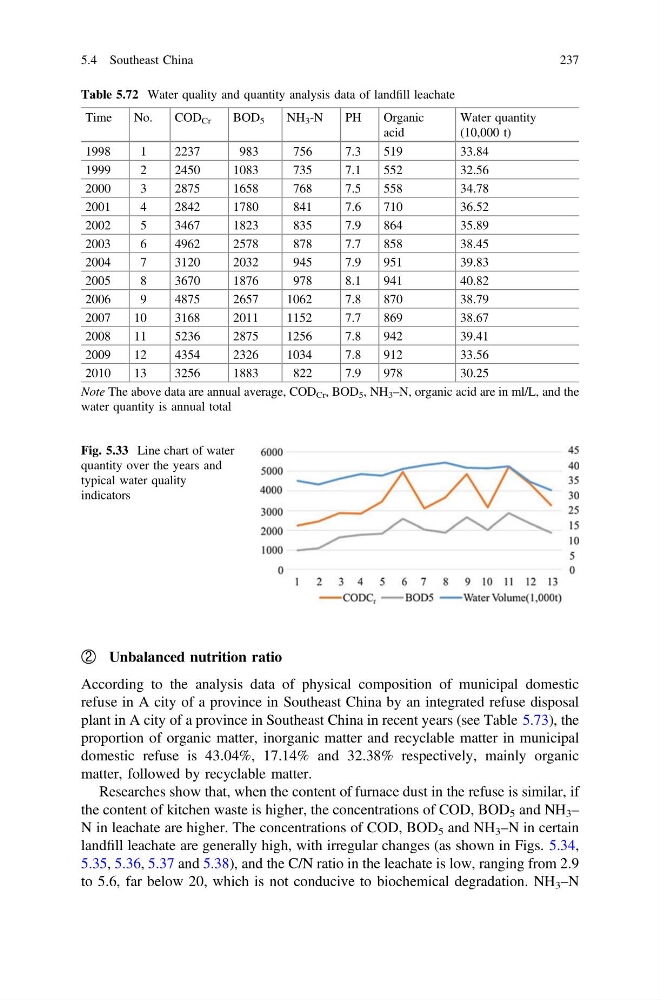
Fig. 5.33 Line chart of water
quantity over the years and
typical water quality
indicators
5.4 Southeast China
237
According to the analysis data of physical composition of municipal domestic
refuse in A city of a province in Southeast China by an integrated refuse disposal
plant in A city of a province in Southeast China in recent years (see Table 5.73), the
proportion of organic matter, inorganic matter and recyclable matter in municipal
domestic refuse is 43.04%, 17.14% and 32.38% respectively, mainly organic
matter, followed by recyclable matter.
Researches show that, when the content of furnace dust in the refuse is similar, if
the content of kitchen waste is higher, the concentrations of COD, BOD 5 and NH 3 –
N in leachate are higher. The concentrations of COD, BOD 5 and NH 3 –N in certain
landfill leachate are generally high, with irregular changes (as shown in Figs. 5.34,
5.35, 5.36, 5.37 and 5.38), and the C/N ratio in the leachate is low, ranging from 2.9
to 5.6, far below 20, which is not conducive to biochemical degradation. NH 3 –N
Table 5.72 Water quality and quantity analysis data of landfill leachate
Time
No.
COD Cr
BOD 5
NH 3 -N
PH
Organic
acid
Water quantity
(10,000 t)
1998
1
2237
983
756
7.3
519
33.84
1999
2
2450
1083
735
7.1
552
32.56
2000
3
2875
1658
768
7.5
558
34.78
2001
4
2842
1780
841
7.6
710
36.52
2002
5
3467
1823
835
7.9
864
35.89
2003
6
4962
2578
878
7.7
858
38.45
2004
7
3120
2032
945
7.9
951
39.83
2005
8
3670
1876
978
8.1
941
40.82
2006
9
4875
2657
1062
7.8
870
38.79
2007
10
3168
2011
1152
7.7
869
38.67
2008
11
5236
2875
1256
7.8
942
39.41
2009
12
4354
2326
1034
7.8
912
33.56
2010
13
3256
1883
822
7.9
978
30.25
Note The above data are annual average, COD Cr , BOD 5 , NH 3 –N, organic acid are in ml/L, and the
water quantity is annual total
Fig. 5.33 Line chart of water
quantity over the years and
typical water quality
indicators
5.4 Southeast China
237