

33 Analysis of Manufacturing Costs for Powder Metallurgy (PM) …
477
General technical and financial data are initially built in the excel tool. These
include throughput time (days), annual volume and batch size (parts), cost of capital
(%), facility rent (currency/m
2 ), energy price (SEK/kWh), number of shifts, work
time (hour/year), labor cost (currency/hour) and currency exchange rates. For the
majority of these general factors the same values as of the authors’ previous case study
(conventional wrought steel gear manufacturing cost analysis Kianian and Andersson
2018) are given for the comparability purpose. Since in authors’ future research, PM
and machining gear manufacturing costs will be compared, the hypothesis will be
that the location (Sweden) and general costs associated with it for both manufacturing
techniques are the same.
The major cost drivers for this case study are material cost (metal powder mixes),
tool cost (e.g. compaction tooling cost, investment cost), equipment cost (e.g. press,
belt furnace) during operation and downtime, OEE, personnel cost, and partially (due
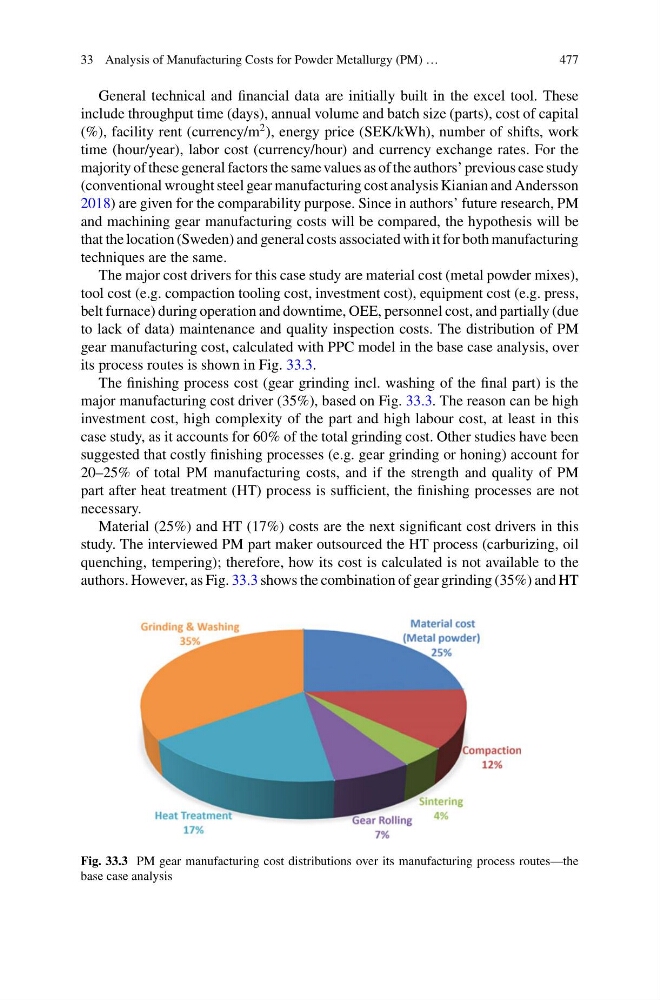
to lack of data) maintenance and quality inspection costs. The distribution of PM
gear manufacturing cost, calculated with PPC model in the base case analysis, over
its process routes is shown in Fig. 33.3.
The finishing process cost (gear grinding incl. washing of the final part) is the
major manufacturing cost driver (35%), based on Fig. 33.3. The reason can be high
investment cost, high complexity of the part and high labour cost, at least in this
case study, as it accounts for 60% of the total grinding cost. Other studies have been
suggested that costly finishing processes (e.g. gear grinding or honing) account for
20–25% of total PM manufacturing costs, and if the strength and quality of PM
part after heat treatment (HT) process is sufficient, the finishing processes are not
necessary.
Material (25%) and HT (17%) costs are the next significant cost drivers in this
study. The interviewed PM part maker outsourced the HT process (carburizing, oil
quenching, tempering); therefore, how its cost is calculated is not available to the
authors. However, as Fig. 33.3 shows the combination of gear grinding (35%) and HT
Fig. 33.3 PM gear manufacturing cost distributions over its manufacturing process routes—the
base case analysis
477
General technical and financial data are initially built in the excel tool. These
include throughput time (days), annual volume and batch size (parts), cost of capital
(%), facility rent (currency/m
2 ), energy price (SEK/kWh), number of shifts, work
time (hour/year), labor cost (currency/hour) and currency exchange rates. For the
majority of these general factors the same values as of the authors’ previous case study
(conventional wrought steel gear manufacturing cost analysis Kianian and Andersson
2018) are given for the comparability purpose. Since in authors’ future research, PM
and machining gear manufacturing costs will be compared, the hypothesis will be
that the location (Sweden) and general costs associated with it for both manufacturing
techniques are the same.
The major cost drivers for this case study are material cost (metal powder mixes),
tool cost (e.g. compaction tooling cost, investment cost), equipment cost (e.g. press,
belt furnace) during operation and downtime, OEE, personnel cost, and partially (due
to lack of data) maintenance and quality inspection costs. The distribution of PM
gear manufacturing cost, calculated with PPC model in the base case analysis, over
its process routes is shown in Fig. 33.3.
The finishing process cost (gear grinding incl. washing of the final part) is the
major manufacturing cost driver (35%), based on Fig. 33.3. The reason can be high
investment cost, high complexity of the part and high labour cost, at least in this
case study, as it accounts for 60% of the total grinding cost. Other studies have been
suggested that costly finishing processes (e.g. gear grinding or honing) account for
20–25% of total PM manufacturing costs, and if the strength and quality of PM
part after heat treatment (HT) process is sufficient, the finishing processes are not
necessary.
Material (25%) and HT (17%) costs are the next significant cost drivers in this
study. The interviewed PM part maker outsourced the HT process (carburizing, oil
quenching, tempering); therefore, how its cost is calculated is not available to the
authors. However, as Fig. 33.3 shows the combination of gear grinding (35%) and HT
Fig. 33.3 PM gear manufacturing cost distributions over its manufacturing process routes—the
base case analysis