

33 Analysis of Manufacturing Costs for Powder Metallurgy (PM) …
473
33.2 Manufacturing Cost Analysis
To be able to compare and generate in depth knowledge, a cost model with representation of the important cost drivers that vary between different technologies are
required. There are immense variations of methods and models to evaluate manufacturing cost, and literature reviews comparing them for both specific applications
and holistically have been done previously (Jönsson 2012; Schultheiss et al. 2018;
Windmark 2018), and also reported by this paper’s authors (Kianian and Andersson
2018). These reviews show that the performance part costing (PPC) model is the
most comprehensive one, and is therefore selected to be used in this study.
The selected PPC is developed to follow the manufacturing process routes. It is
created for the discrete manufacturing processes based on batch size and it provides
part’s (e.g. gearwheel) cost per unit. It was originally developed to assess and compare
alternative production systems to support decision makers in manufacturing firms
with their production development agenda e.g. selection among different production
location alternatives. It integrates technical performance parameters with economical
parameters to determine the entire influence of production performance on cost in
order to suggest improvement opportunities and find or create best cost efficiency
(Jönsson 2012; Ståhl et al. 2007).
The design of the PPC model is based on the principle cost components, e.g. raw
material, tool, equipment during operation, standby and downtime, personnel, maintenance and quality cost, which are indispensable for the complete manufacturing of
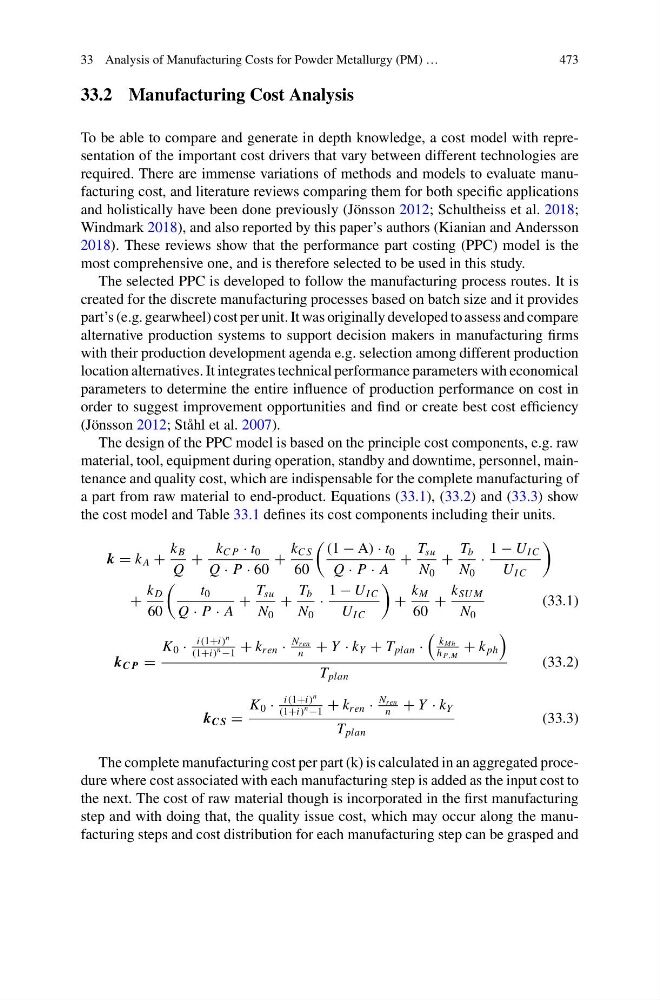
a part from raw material to end-product. Equations (33.1), (33.2) and (33.3) show
the cost model and Table 33.1 defines its cost components including their units.
k = k A +
k B
Q
+
k C P · t 0
Q · P · 60
+
k C S
60
(1 − A) · t 0
Q · P · A
+
T su
N 0
+
T b
N 0
·
1 − U I C
U I C
+
k D
60
t 0
Q · P · A
+
T su
N 0
+
T b
N 0
·
1 − U I C
U I C
+
k M
60
+
k SU M
N 0
(33.1)
k C P =
K 0 ·
i(1+i)
n
(1+i)
n −1
+ k ren ·
N ren
n
+ Y · k Y + T plan ·
k Mh
h P,M
+ k ph
T plan
(33.2)
k C S =
K 0 ·
i(1+i)
n
(1+i)
n −1
+ k ren ·
N ren
n
+ Y · k Y
T plan
(33.3)
The complete manufacturing cost per part (k) is calculated in an aggregated procedure where cost associated with each manufacturing step is added as the input cost to
the next. The cost of raw material though is incorporated in the first manufacturing
step and with doing that, the quality issue cost, which may occur along the manufacturing steps and cost distribution for each manufacturing step can be grasped and
473
33.2 Manufacturing Cost Analysis
To be able to compare and generate in depth knowledge, a cost model with representation of the important cost drivers that vary between different technologies are
required. There are immense variations of methods and models to evaluate manufacturing cost, and literature reviews comparing them for both specific applications
and holistically have been done previously (Jönsson 2012; Schultheiss et al. 2018;
Windmark 2018), and also reported by this paper’s authors (Kianian and Andersson
2018). These reviews show that the performance part costing (PPC) model is the
most comprehensive one, and is therefore selected to be used in this study.
The selected PPC is developed to follow the manufacturing process routes. It is
created for the discrete manufacturing processes based on batch size and it provides
part’s (e.g. gearwheel) cost per unit. It was originally developed to assess and compare
alternative production systems to support decision makers in manufacturing firms
with their production development agenda e.g. selection among different production
location alternatives. It integrates technical performance parameters with economical
parameters to determine the entire influence of production performance on cost in
order to suggest improvement opportunities and find or create best cost efficiency
(Jönsson 2012; Ståhl et al. 2007).
The design of the PPC model is based on the principle cost components, e.g. raw
material, tool, equipment during operation, standby and downtime, personnel, maintenance and quality cost, which are indispensable for the complete manufacturing of
a part from raw material to end-product. Equations (33.1), (33.2) and (33.3) show
the cost model and Table 33.1 defines its cost components including their units.
k = k A +
k B
Q
+
k C P · t 0
Q · P · 60
+
k C S
60
(1 − A) · t 0
Q · P · A
+
T su
N 0
+
T b
N 0
·
1 − U I C
U I C
+
k D
60
t 0
Q · P · A
+
T su
N 0
+
T b
N 0
·
1 − U I C
U I C
+
k M
60
+
k SU M
N 0
(33.1)
k C P =
K 0 ·
i(1+i)
n
(1+i)
n −1
+ k ren ·
N ren
n
+ Y · k Y + T plan ·
k Mh
h P,M
+ k ph
T plan
(33.2)
k C S =
K 0 ·
i(1+i)
n
(1+i)
n −1
+ k ren ·
N ren
n
+ Y · k Y
T plan
(33.3)
The complete manufacturing cost per part (k) is calculated in an aggregated procedure where cost associated with each manufacturing step is added as the input cost to
the next. The cost of raw material though is incorporated in the first manufacturing
step and with doing that, the quality issue cost, which may occur along the manufacturing steps and cost distribution for each manufacturing step can be grasped and