

448
A. Halász et al.
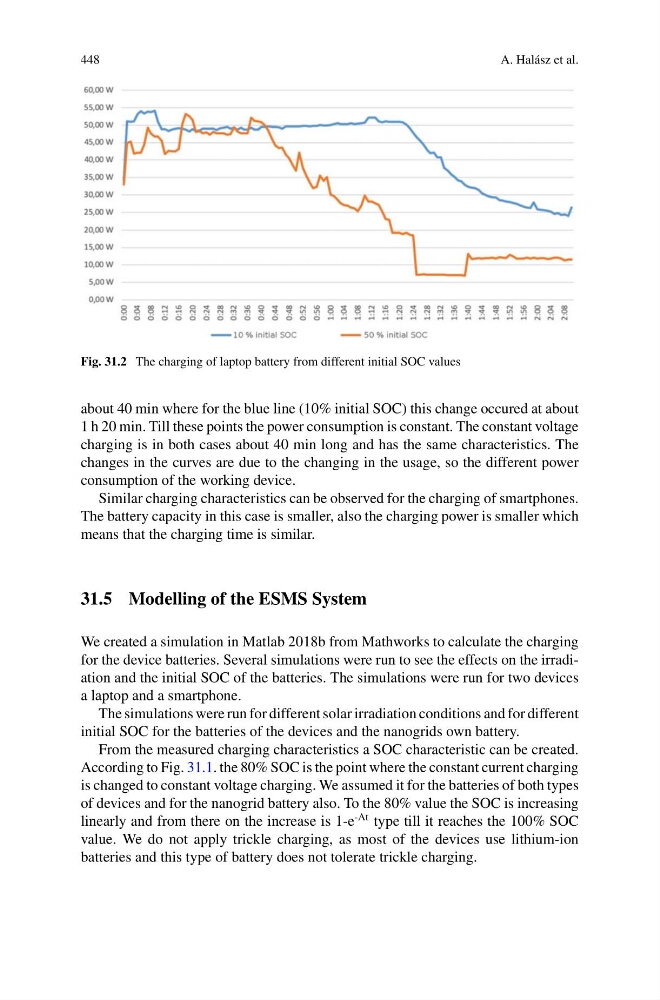
Fig. 31.2 The charging of laptop battery from different initial SOC values
about 40 min where for the blue line (10% initial SOC) this change occured at about
1 h 20 min. Till these points the power consumption is constant. The constant voltage
charging is in both cases about 40 min long and has the same characteristics. The
changes in the curves are due to the changing in the usage, so the different power
consumption of the working device.
Similar charging characteristics can be observed for the charging of smartphones.
The battery capacity in this case is smaller, also the charging power is smaller which
means that the charging time is similar.
31.5 Modelling of the ESMS System
We created a simulation in Matlab 2018b from Mathworks to calculate the charging
for the device batteries. Several simulations were run to see the effects on the irradiation and the initial SOC of the batteries. The simulations were run for two devices
a laptop and a smartphone.
The simulations were run for different solar irradiation conditions and for different
initial SOC for the batteries of the devices and the nanogrids own battery.
From the measured charging characteristics a SOC characteristic can be created.
According to Fig. 31.1. the 80% SOC is the point where the constant current charging
is changed to constant voltage charging. We assumed it for the batteries of both types
of devices and for the nanogrid battery also. To the 80% value the SOC is increasing
linearly and from there on the increase is 1-e
-At type till it reaches the 100% SOC
value. We do not apply trickle charging, as most of the devices use lithium-ion
batteries and this type of battery does not tolerate trickle charging.
A. Halász et al.
Fig. 31.2 The charging of laptop battery from different initial SOC values
about 40 min where for the blue line (10% initial SOC) this change occured at about
1 h 20 min. Till these points the power consumption is constant. The constant voltage
charging is in both cases about 40 min long and has the same characteristics. The
changes in the curves are due to the changing in the usage, so the different power
consumption of the working device.
Similar charging characteristics can be observed for the charging of smartphones.
The battery capacity in this case is smaller, also the charging power is smaller which
means that the charging time is similar.
31.5 Modelling of the ESMS System
We created a simulation in Matlab 2018b from Mathworks to calculate the charging
for the device batteries. Several simulations were run to see the effects on the irradiation and the initial SOC of the batteries. The simulations were run for two devices
a laptop and a smartphone.
The simulations were run for different solar irradiation conditions and for different
initial SOC for the batteries of the devices and the nanogrids own battery.
From the measured charging characteristics a SOC characteristic can be created.
According to Fig. 31.1. the 80% SOC is the point where the constant current charging
is changed to constant voltage charging. We assumed it for the batteries of both types
of devices and for the nanogrid battery also. To the 80% value the SOC is increasing
linearly and from there on the increase is 1-e
-At type till it reaches the 100% SOC
value. We do not apply trickle charging, as most of the devices use lithium-ion
batteries and this type of battery does not tolerate trickle charging.