

276
K. Asai et al.
0
500
1,000
1,500
2,000
2,500
3,000
3,500
4,000
(a)
(b)
(c)
number of items
Initial inventories
manufactured
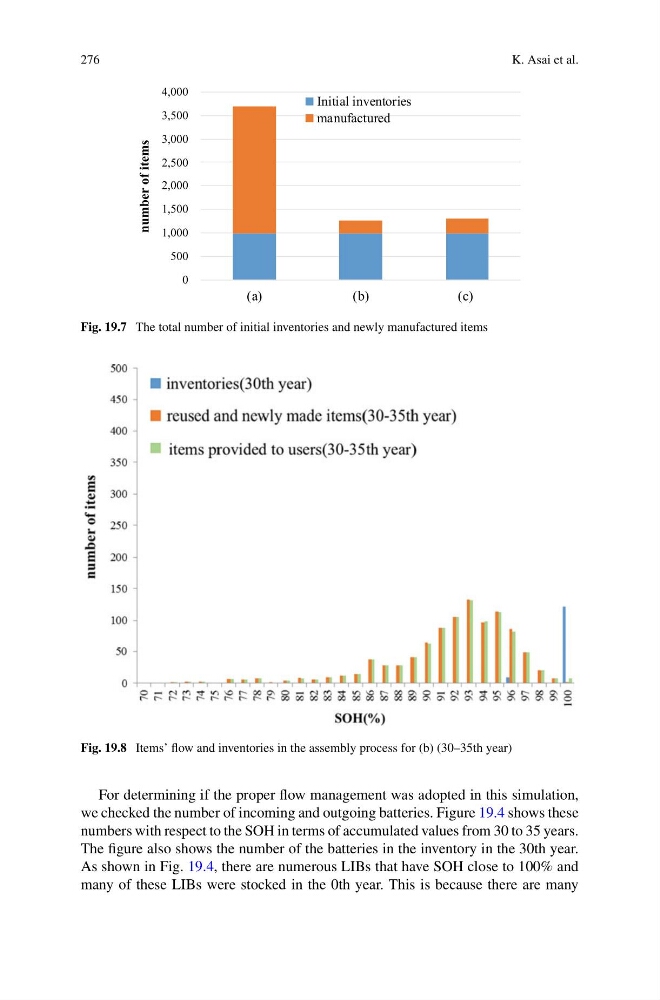
Fig. 19.7 The total number of initial inventories and newly manufactured items
Fig. 19.8 Items’ flow and inventories in the assembly process for (b) (30–35th year)
For determining if the proper flow management was adopted in this simulation,
we checked the number of incoming and outgoing batteries. Figure 19.4 shows these
numbers with respect to the SOH in terms of accumulated values from 30 to 35 years.
The figure also shows the number of the batteries in the inventory in the 30th year.
As shown in Fig. 19.4, there are numerous LIBs that have SOH close to 100% and
many of these LIBs were stocked in the 0th year. This is because there are many
K. Asai et al.
0
500
1,000
1,500
2,000
2,500
3,000
3,500
4,000
(a)
(b)
(c)
number of items
Initial inventories
manufactured
Fig. 19.7 The total number of initial inventories and newly manufactured items
Fig. 19.8 Items’ flow and inventories in the assembly process for (b) (30–35th year)
For determining if the proper flow management was adopted in this simulation,
we checked the number of incoming and outgoing batteries. Figure 19.4 shows these
numbers with respect to the SOH in terms of accumulated values from 30 to 35 years.
The figure also shows the number of the batteries in the inventory in the 30th year.
As shown in Fig. 19.4, there are numerous LIBs that have SOH close to 100% and
many of these LIBs were stocked in the 0th year. This is because there are many