

10 Video Networks of Sustainable Design: The Doughnut Perspective
139
about architecture and graphic design were from BC countries; most videos about
industrial design and the mixed area were from SC countries; and most videos about
the general area were from BSC and BC countries (p < 0.005). The architecture
content was related to both cities and rural localities.
10.3.2 Uploaders and Speakers in the Doughnut
Most English videos from BC countries were uploaded by Universities (699, 38.9%),
most from SC countries by media channels (34, 1.8%), and most from BSC countries
by students (8, 0.4%). These student videos were mostly related to Shell. As for
Spanish, most videos from BC and SC countries were uploaded by Universities
(100, 12.6%; 64, 8.1%), with content predominantly about architecture and fashion
design respectively. Most videos from BSC countries were uploaded by media (63,
7.9%), which included public television channels.
As for speakers, most English videos from BC countries showed professors (419,
23.3%); most from SC countries showed designers (30, 1.6%); and most from BSC
countries, students or didn’t depict humans at all (9, 0.5% in both cases). Videos
by students were once more related to Shell. In contrast, most Spanish videos from
BC countries showed a mix of education related individuals with other people (58,
7.35%). Most videos from SC countries showed students (56, 7%), predominantly
related to toys. Finally, videos from BSC countries showed designers (56, 7%)
principally.
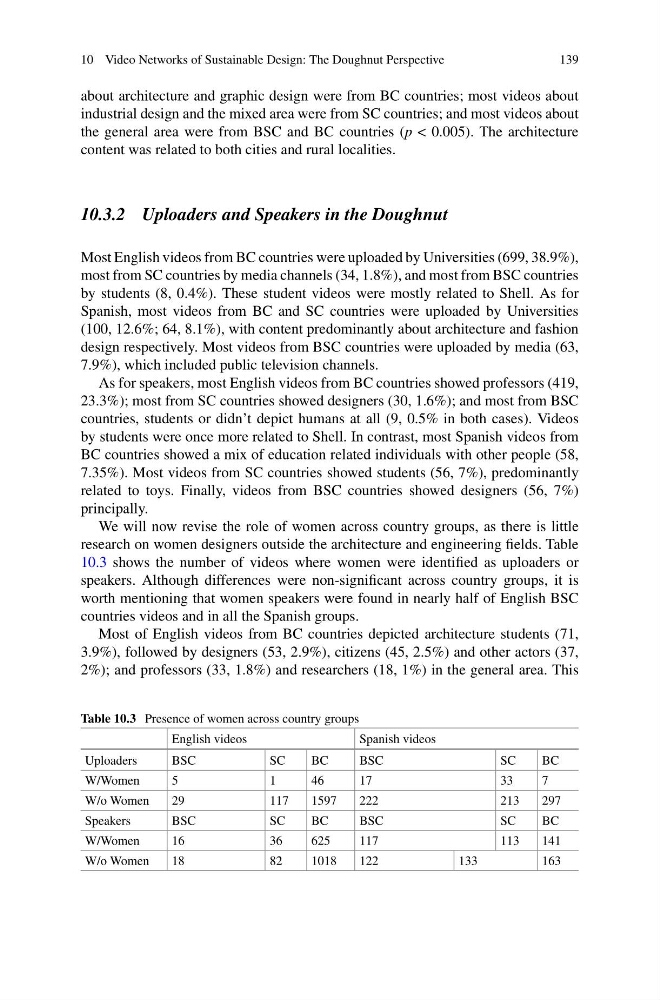
We will now revise the role of women across country groups, as there is little
research on women designers outside the architecture and engineering fields. Table
10.3 shows the number of videos where women were identified as uploaders or
speakers. Although differences were non-significant across country groups, it is
worth mentioning that women speakers were found in nearly half of English BSC
countries videos and in all the Spanish groups.
Most of English videos from BC countries depicted architecture students (71,
3.9%), followed by designers (53, 2.9%), citizens (45, 2.5%) and other actors (37,
2%); and professors (33, 1.8%) and researchers (18, 1%) in the general area. This
Table 10.3 Presence of women across country groups
English videos
Spanish videos
Uploaders
BSC
SC
BC
BSC
SC
BC
W/Women
5
1
46
17
33
7
W/o Women
29
117
1597
222
213
297
Speakers
BSC
SC
BC
BSC
SC
BC
W/Women
16
36
625
117
113
141
W/o Women
18
82
1018
122
133
163
139
about architecture and graphic design were from BC countries; most videos about
industrial design and the mixed area were from SC countries; and most videos about
the general area were from BSC and BC countries (p < 0.005). The architecture
content was related to both cities and rural localities.
10.3.2 Uploaders and Speakers in the Doughnut
Most English videos from BC countries were uploaded by Universities (699, 38.9%),
most from SC countries by media channels (34, 1.8%), and most from BSC countries
by students (8, 0.4%). These student videos were mostly related to Shell. As for
Spanish, most videos from BC and SC countries were uploaded by Universities
(100, 12.6%; 64, 8.1%), with content predominantly about architecture and fashion
design respectively. Most videos from BSC countries were uploaded by media (63,
7.9%), which included public television channels.
As for speakers, most English videos from BC countries showed professors (419,
23.3%); most from SC countries showed designers (30, 1.6%); and most from BSC
countries, students or didn’t depict humans at all (9, 0.5% in both cases). Videos
by students were once more related to Shell. In contrast, most Spanish videos from
BC countries showed a mix of education related individuals with other people (58,
7.35%). Most videos from SC countries showed students (56, 7%), predominantly
related to toys. Finally, videos from BSC countries showed designers (56, 7%)
principally.
We will now revise the role of women across country groups, as there is little
research on women designers outside the architecture and engineering fields. Table
10.3 shows the number of videos where women were identified as uploaders or
speakers. Although differences were non-significant across country groups, it is
worth mentioning that women speakers were found in nearly half of English BSC
countries videos and in all the Spanish groups.
Most of English videos from BC countries depicted architecture students (71,
3.9%), followed by designers (53, 2.9%), citizens (45, 2.5%) and other actors (37,
2%); and professors (33, 1.8%) and researchers (18, 1%) in the general area. This
Table 10.3 Presence of women across country groups
English videos
Spanish videos
Uploaders
BSC
SC
BC
BSC
SC
BC
W/Women
5
1
46
17
33
7
W/o Women
29
117
1597
222
213
297
Speakers
BSC
SC
BC
BSC
SC
BC
W/Women
16
36
625
117
113
141
W/o Women
18
82
1018
122
133
163