

économique, he established the bases of the economic theory of the physiocrats.
Chronologically, it is also worth acknowledging the contributions of Leon Walras’
theory of general equilibrium (Walras 1874), Wilfred Pareto’s study of private
property tenure and, at the same time, the contributions of Kenneth Arrow and
Gerard Debreu on the balance between supply and aggregate demand for each good
or service of a specific set of prices (Arrow and Debreu 1954; Pareto 1906).
A study carried out by the FAO (Bracco et al. 2018) estimated the contribution of
the bioeconomy in various countries. It concluded that the most appropriate
approaches are descriptive macro-economic models with a top-down structure that
allow for the evaluation of interactions between different actors in the economy.
Such models include the input–output model, the general equilibrium model, and the
social accounting matrix. Therefore, this study focuses on and carries out a literary
review of the analysis of these types of models.
3.4.1 Input–Output Model (IOM)
The input–output model (IOM) was proposed by Nobel laureate economist Wassily
Leontief. It consists of a system of linear equations that quantifies the
interdependencies between the different sectors in an economic system, which are
then compiled into a set of matrices to evaluate the behaviour of all actors in the face
of external variations. Hence, the matrix representing the productive structure is also
called Leontief’s matrix (L ).
The input–output model is based on existing transactions in all economic sectors,
information that may generally be obtained from the countries’ official economic
policy agencies. In the model, the quantity of goods and/or services demanded by
sector j of sector i output, measured in monetary terms for a given period, is the result
of a z ij flow of goods and services across sectors. Thus, the production of sector i,
denoted as x i , is demanded by all intermediate sectors and final consumers (y i ) such
as households, government, fixed capital formation, and net exports.
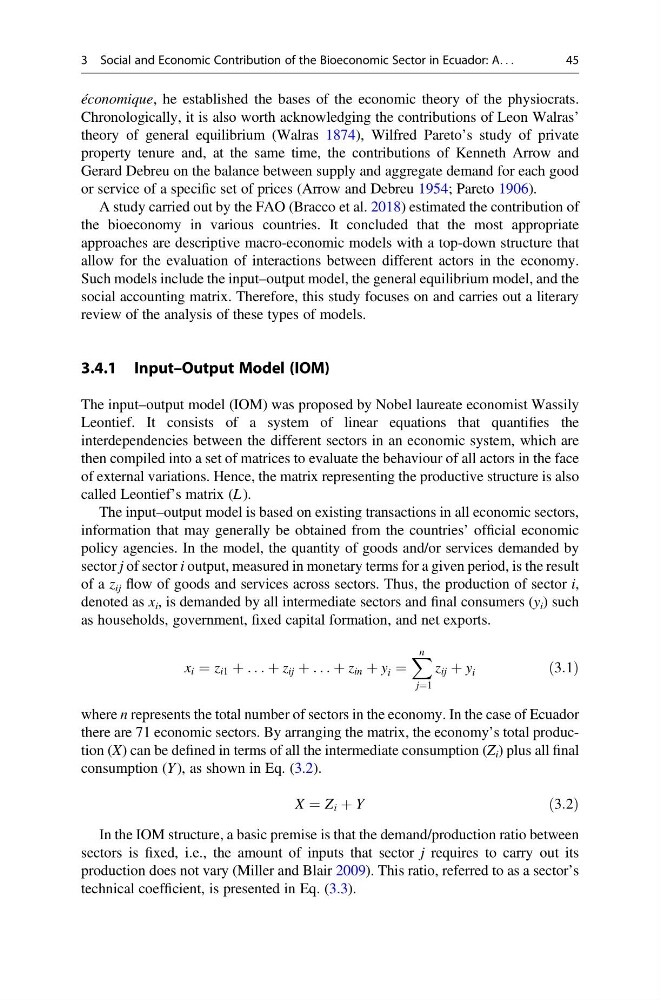
x i ¼ z i1 þ . . . þ z ij þ . . . þ z in þ y i ¼
X n
j¼1
z ij þ y i
ð3:1Þ
where n represents the total number of sectors in the economy. In the case of Ecuador
there are 71 economic sectors. By arranging the matrix, the economy’s total production (X) can be defined in terms of all the intermediate consumption (Z i ) plus all final
consumption (Y ), as shown in Eq. (3.2).
X ¼ Z i þ Y
ð3:2Þ
In the IOM structure, a basic premise is that the demand/production ratio between
sectors is fixed, i.e., the amount of inputs that sector j requires to carry out its
production does not vary (Miller and Blair 2009). This ratio, referred to as a sector’s
technical coefficient, is presented in Eq. (3.3).
3 Social and Economic Contribution of the Bioeconomic Sector in Ecuador: A. . .
45
Chronologically, it is also worth acknowledging the contributions of Leon Walras’
theory of general equilibrium (Walras 1874), Wilfred Pareto’s study of private
property tenure and, at the same time, the contributions of Kenneth Arrow and
Gerard Debreu on the balance between supply and aggregate demand for each good
or service of a specific set of prices (Arrow and Debreu 1954; Pareto 1906).
A study carried out by the FAO (Bracco et al. 2018) estimated the contribution of
the bioeconomy in various countries. It concluded that the most appropriate
approaches are descriptive macro-economic models with a top-down structure that
allow for the evaluation of interactions between different actors in the economy.
Such models include the input–output model, the general equilibrium model, and the
social accounting matrix. Therefore, this study focuses on and carries out a literary
review of the analysis of these types of models.
3.4.1 Input–Output Model (IOM)
The input–output model (IOM) was proposed by Nobel laureate economist Wassily
Leontief. It consists of a system of linear equations that quantifies the
interdependencies between the different sectors in an economic system, which are
then compiled into a set of matrices to evaluate the behaviour of all actors in the face
of external variations. Hence, the matrix representing the productive structure is also
called Leontief’s matrix (L ).
The input–output model is based on existing transactions in all economic sectors,
information that may generally be obtained from the countries’ official economic
policy agencies. In the model, the quantity of goods and/or services demanded by
sector j of sector i output, measured in monetary terms for a given period, is the result
of a z ij flow of goods and services across sectors. Thus, the production of sector i,
denoted as x i , is demanded by all intermediate sectors and final consumers (y i ) such
as households, government, fixed capital formation, and net exports.
x i ¼ z i1 þ . . . þ z ij þ . . . þ z in þ y i ¼
X n
j¼1
z ij þ y i
ð3:1Þ
where n represents the total number of sectors in the economy. In the case of Ecuador
there are 71 economic sectors. By arranging the matrix, the economy’s total production (X) can be defined in terms of all the intermediate consumption (Z i ) plus all final
consumption (Y ), as shown in Eq. (3.2).
X ¼ Z i þ Y
ð3:2Þ
In the IOM structure, a basic premise is that the demand/production ratio between
sectors is fixed, i.e., the amount of inputs that sector j requires to carry out its
production does not vary (Miller and Blair 2009). This ratio, referred to as a sector’s
technical coefficient, is presented in Eq. (3.3).
3 Social and Economic Contribution of the Bioeconomic Sector in Ecuador: A. . .
45