

factors are supposed to increase the depletion of K nutrients and create negative
externalities.
15.3.5 Status of K Balance
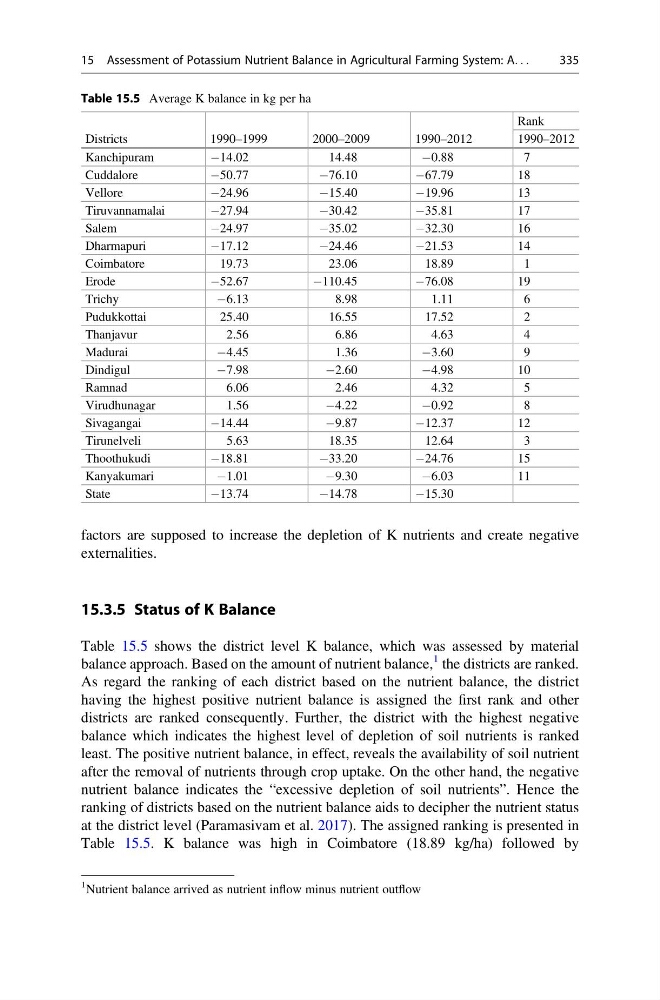
Table 15.5 shows the district level K balance, which was assessed by material
balance approach. Based on the amount of nutrient balance,
1 the districts are ranked.
As regard the ranking of each district based on the nutrient balance, the district
having the highest positive nutrient balance is assigned the first rank and other
districts are ranked consequently. Further, the district with the highest negative
balance which indicates the highest level of depletion of soil nutrients is ranked
least. The positive nutrient balance, in effect, reveals the availability of soil nutrient
after the removal of nutrients through crop uptake. On the other hand, the negative
nutrient balance indicates the “excessive depletion of soil nutrients”. Hence the
ranking of districts based on the nutrient balance aids to decipher the nutrient status
at the district level (Paramasivam et al. 2017). The assigned ranking is presented in
Table 15.5. K balance was high in Coimbatore (18.89 kg/ha) followed by
Table 15.5 Average K balance in kg per ha
Districts
1990–1999
2000–2009
1990–2012
Rank
1990–2012
Kanchipuram
À14.02
14.48
À0.88
7
Cuddalore
À50.77
À76.10
À67.79
18
Vellore
À24.96
À15.40
À19.96
13
Tiruvannamalai
À27.94
À30.42
À35.81
17
Salem
À24.97
À35.02
À32.30
16
Dharmapuri
À17.12
À24.46
À21.53
14
Coimbatore
19.73
23.06
18.89
1
Erode
À52.67
À110.45
À76.08
19
Trichy
À6.13
8.98
1.11
6
Pudukkottai
25.40
16.55
17.52
2
Thanjavur
2.56
6.86
4.63
4
Madurai
À4.45
1.36
À3.60
9
Dindigul
À7.98
À2.60
À4.98
10
Ramnad
6.06
2.46
4.32
5
Virudhunagar
1.56
À4.22
À0.92
8
Sivagangai
À14.44
À9.87
À12.37
12
Tirunelveli
5.63
18.35
12.64
3
Thoothukudi
À18.81
À33.20
À24.76
15
Kanyakumari
À1.01
À9.30
À6.03
11
State
À13.74
À14.78
À15.30
1 Nutrient balance arrived as nutrient inflow minus nutrient outflow
15 Assessment of Potassium Nutrient Balance in Agricultural Farming System: A. . .
335
externalities.
15.3.5 Status of K Balance
Table 15.5 shows the district level K balance, which was assessed by material
balance approach. Based on the amount of nutrient balance,
1 the districts are ranked.
As regard the ranking of each district based on the nutrient balance, the district
having the highest positive nutrient balance is assigned the first rank and other
districts are ranked consequently. Further, the district with the highest negative
balance which indicates the highest level of depletion of soil nutrients is ranked
least. The positive nutrient balance, in effect, reveals the availability of soil nutrient
after the removal of nutrients through crop uptake. On the other hand, the negative
nutrient balance indicates the “excessive depletion of soil nutrients”. Hence the
ranking of districts based on the nutrient balance aids to decipher the nutrient status
at the district level (Paramasivam et al. 2017). The assigned ranking is presented in
Table 15.5. K balance was high in Coimbatore (18.89 kg/ha) followed by
Table 15.5 Average K balance in kg per ha
Districts
1990–1999
2000–2009
1990–2012
Rank
1990–2012
Kanchipuram
À14.02
14.48
À0.88
7
Cuddalore
À50.77
À76.10
À67.79
18
Vellore
À24.96
À15.40
À19.96
13
Tiruvannamalai
À27.94
À30.42
À35.81
17
Salem
À24.97
À35.02
À32.30
16
Dharmapuri
À17.12
À24.46
À21.53
14
Coimbatore
19.73
23.06
18.89
1
Erode
À52.67
À110.45
À76.08
19
Trichy
À6.13
8.98
1.11
6
Pudukkottai
25.40
16.55
17.52
2
Thanjavur
2.56
6.86
4.63
4
Madurai
À4.45
1.36
À3.60
9
Dindigul
À7.98
À2.60
À4.98
10
Ramnad
6.06
2.46
4.32
5
Virudhunagar
1.56
À4.22
À0.92
8
Sivagangai
À14.44
À9.87
À12.37
12
Tirunelveli
5.63
18.35
12.64
3
Thoothukudi
À18.81
À33.20
À24.76
15
Kanyakumari
À1.01
À9.30
À6.03
11
State
À13.74
À14.78
À15.30
1 Nutrient balance arrived as nutrient inflow minus nutrient outflow
15 Assessment of Potassium Nutrient Balance in Agricultural Farming System: A. . .
335