

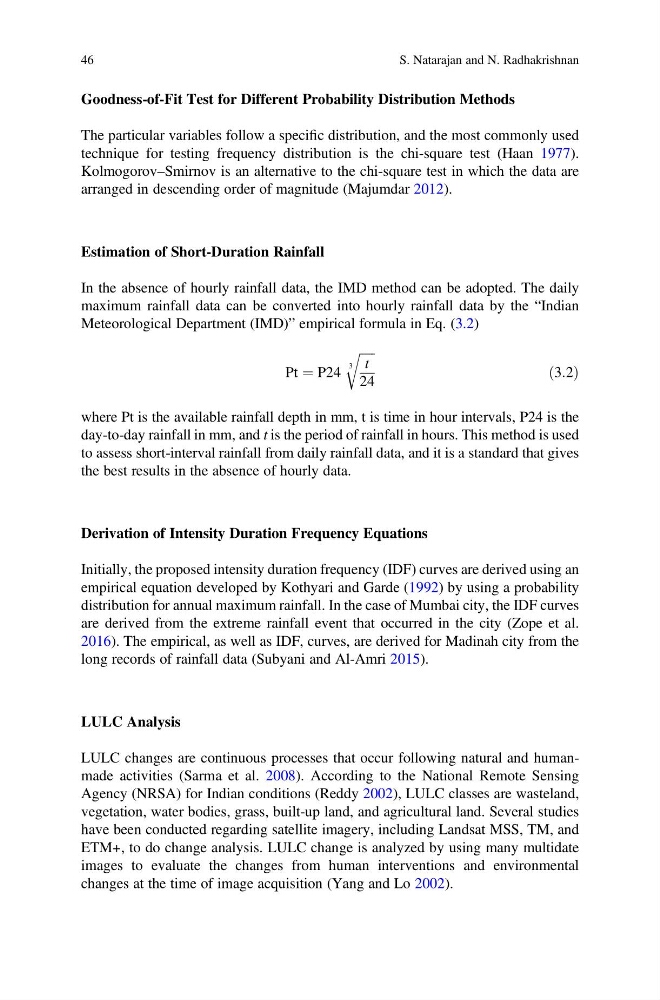
Goodness-of-Fit Test for Different Probability Distribution Methods
The particular variables follow a specific distribution, and the most commonly used
technique for testing frequency distribution is the chi-square test (Haan 1977).
Kolmogorov–Smirnov is an alternative to the chi-square test in which the data are
arranged in descending order of magnitude (Majumdar 2012).
Estimation of Short-Duration Rainfall
In the absence of hourly rainfall data, the IMD method can be adopted. The daily
maximum rainfall data can be converted into hourly rainfall data by the “Indian
Meteorological Department (IMD)” empirical formula in Eq. (3.2)
Pt ¼ P24
ffiffiffiffiffi
t
24
3
r
ð3:2Þ
where Pt is the available rainfall depth in mm, t is time in hour intervals, P24 is the
day-to-day rainfall in mm, and t is the period of rainfall in hours. This method is used
to assess short-interval rainfall from daily rainfall data, and it is a standard that gives
the best results in the absence of hourly data.
Derivation of Intensity Duration Frequency Equations
Initially, the proposed intensity duration frequency (IDF) curves are derived using an
empirical equation developed by Kothyari and Garde (1992) by using a probability
distribution for annual maximum rainfall. In the case of Mumbai city, the IDF curves
are derived from the extreme rainfall event that occurred in the city (Zope et al.
2016). The empirical, as well as IDF, curves, are derived for Madinah city from the
long records of rainfall data (Subyani and Al-Amri 2015).
LULC Analysis
LULC changes are continuous processes that occur following natural and humanmade activities (Sarma et al. 2008). According to the National Remote Sensing
Agency (NRSA) for Indian conditions (Reddy 2002), LULC classes are wasteland,
vegetation, water bodies, grass, built-up land, and agricultural land. Several studies
have been conducted regarding satellite imagery, including Landsat MSS, TM, and
ETM+, to do change analysis. LULC change is analyzed by using many multidate
images to evaluate the changes from human interventions and environmental
changes at the time of image acquisition (Yang and Lo 2002).
46
S. Natarajan and N. Radhakrishnan
The particular variables follow a specific distribution, and the most commonly used
technique for testing frequency distribution is the chi-square test (Haan 1977).
Kolmogorov–Smirnov is an alternative to the chi-square test in which the data are
arranged in descending order of magnitude (Majumdar 2012).
Estimation of Short-Duration Rainfall
In the absence of hourly rainfall data, the IMD method can be adopted. The daily
maximum rainfall data can be converted into hourly rainfall data by the “Indian
Meteorological Department (IMD)” empirical formula in Eq. (3.2)
Pt ¼ P24
ffiffiffiffiffi
t
24
3
r
ð3:2Þ
where Pt is the available rainfall depth in mm, t is time in hour intervals, P24 is the
day-to-day rainfall in mm, and t is the period of rainfall in hours. This method is used
to assess short-interval rainfall from daily rainfall data, and it is a standard that gives
the best results in the absence of hourly data.
Derivation of Intensity Duration Frequency Equations
Initially, the proposed intensity duration frequency (IDF) curves are derived using an
empirical equation developed by Kothyari and Garde (1992) by using a probability
distribution for annual maximum rainfall. In the case of Mumbai city, the IDF curves
are derived from the extreme rainfall event that occurred in the city (Zope et al.
2016). The empirical, as well as IDF, curves, are derived for Madinah city from the
long records of rainfall data (Subyani and Al-Amri 2015).
LULC Analysis
LULC changes are continuous processes that occur following natural and humanmade activities (Sarma et al. 2008). According to the National Remote Sensing
Agency (NRSA) for Indian conditions (Reddy 2002), LULC classes are wasteland,
vegetation, water bodies, grass, built-up land, and agricultural land. Several studies
have been conducted regarding satellite imagery, including Landsat MSS, TM, and
ETM+, to do change analysis. LULC change is analyzed by using many multidate
images to evaluate the changes from human interventions and environmental
changes at the time of image acquisition (Yang and Lo 2002).
46
S. Natarajan and N. Radhakrishnan